Why I Started TraceBean: The Upstream EUDR Problem Nobody Talks About

Everyone is focused on DDS generation. The real bottleneck is what happens before that — when raw supplier files arrive with swapped coordinates, broken polygons, and empty fields.
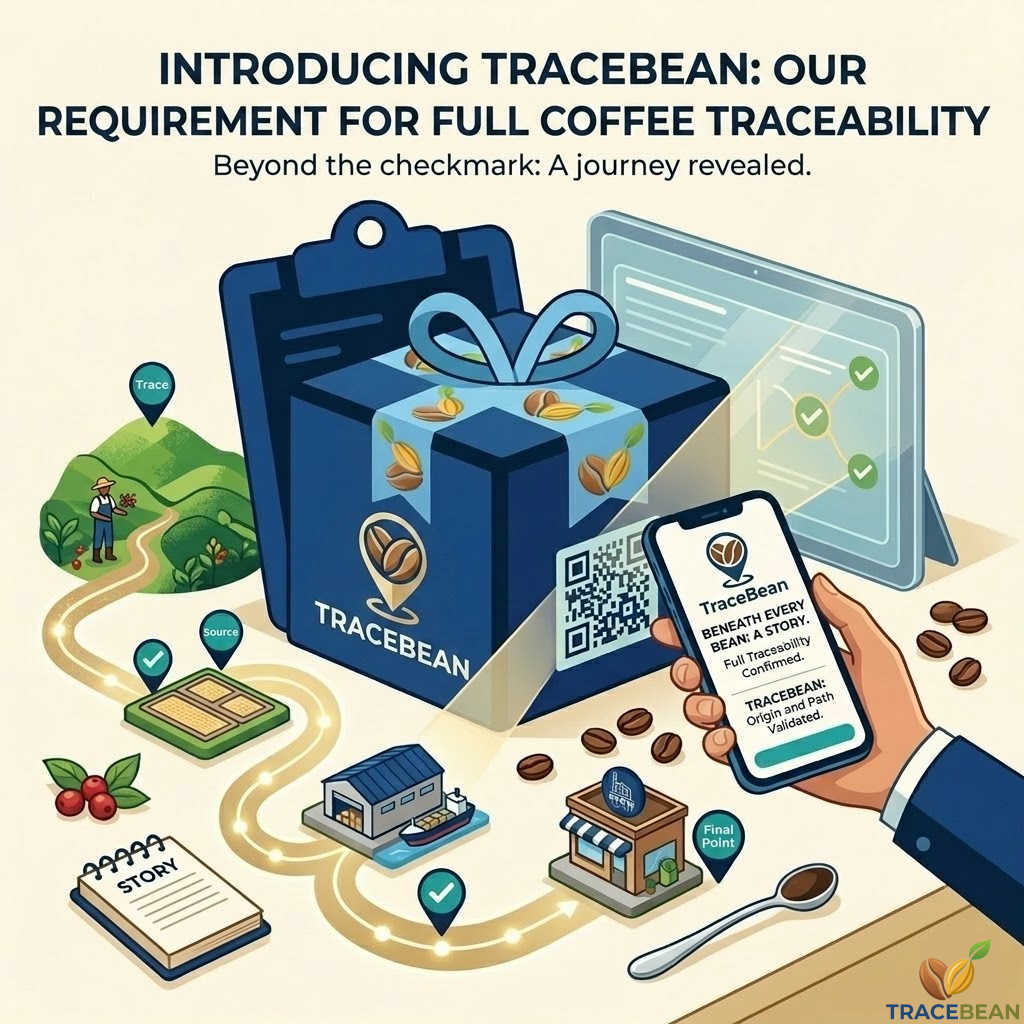
Introducing TraceBean: Our Requirentment For Full Coffee Traceability

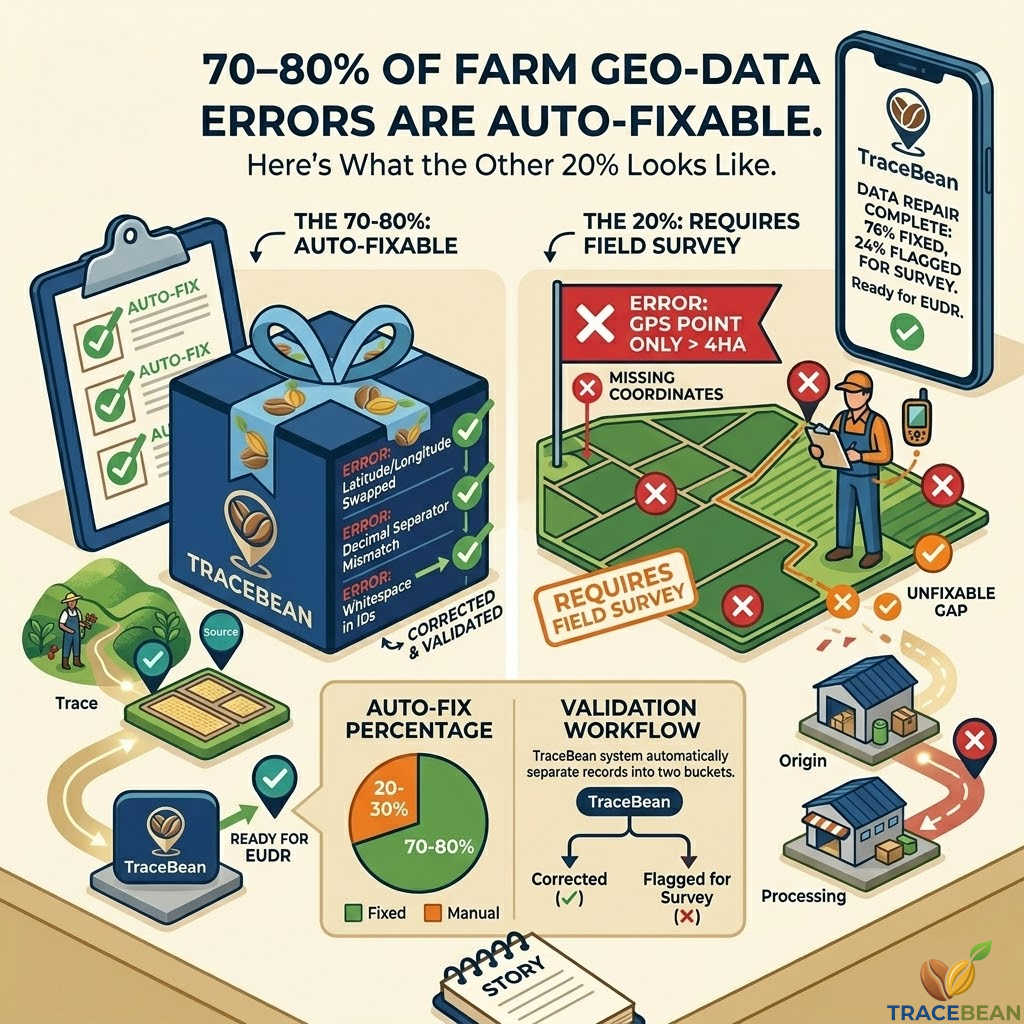
70–80% of Farm Geo-Data Errors Are Auto-Fixable. Here's What the Other 20% Looks Like

Not all supplier data problems are equal. Some fix themselves in seconds. Others require a field survey.

TraceBean can fix 70–80% of Farm Geo-Data Errors

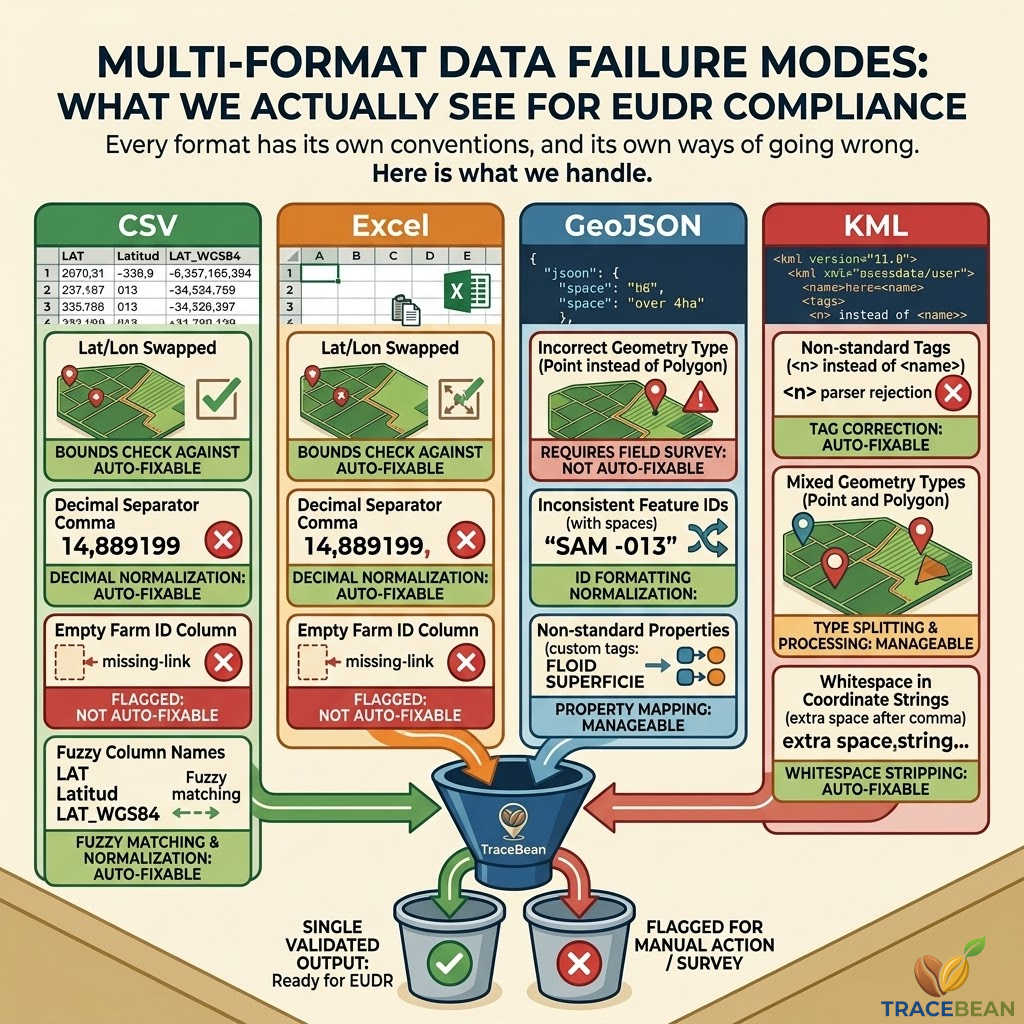
CSV, GeoJSON, KML, Excel — What We Actually See When Supplier Files Arrive for EUDR Compliance

Every format has its own failure modes. Here is what breaks, and why.

Multi-format data failure modes for EUDR compliance

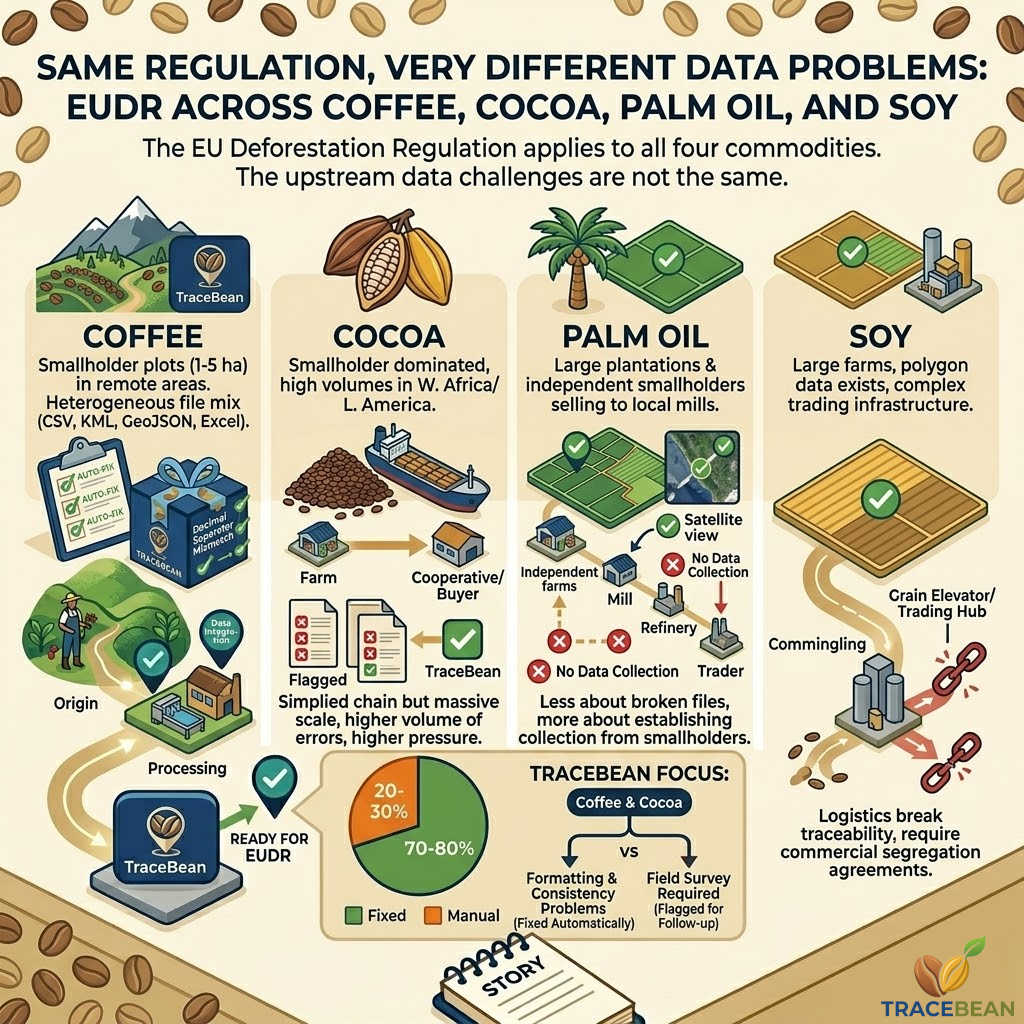
Same Regulation, Very Different Data Problems: EUDR Across Coffee, Cocoa, Palm Oil, and Soy

The EU Deforestation Regulation applies to all four commodities. The upstream data challenges are not the same.

Same EUDR regulation, four very different upstream data challenges.

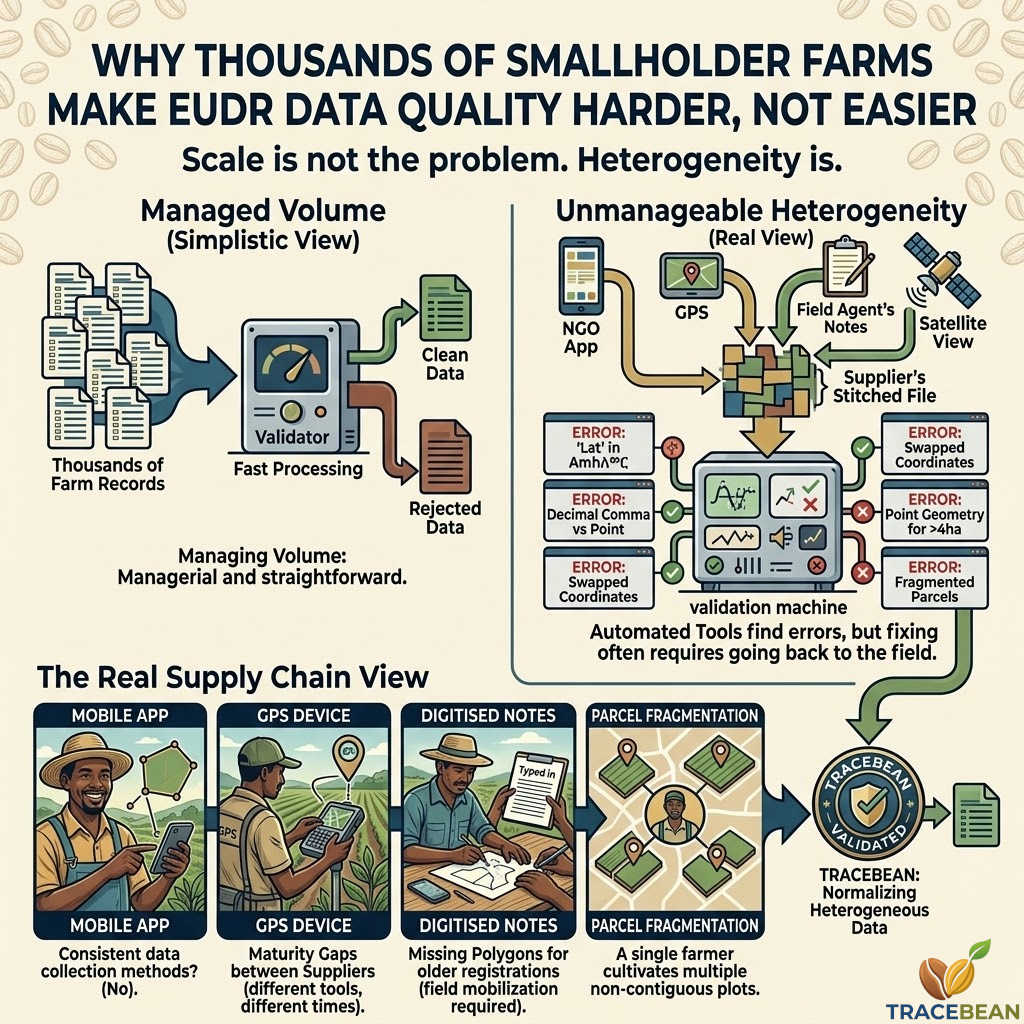
Why Thousands of Smallholder Farms Make EUDR Data Quality Harder, Not Easier

Scale is not the problem. Heterogeneity is.

Why thousands of smallholder farms make EUDR data quality harder, not easier.

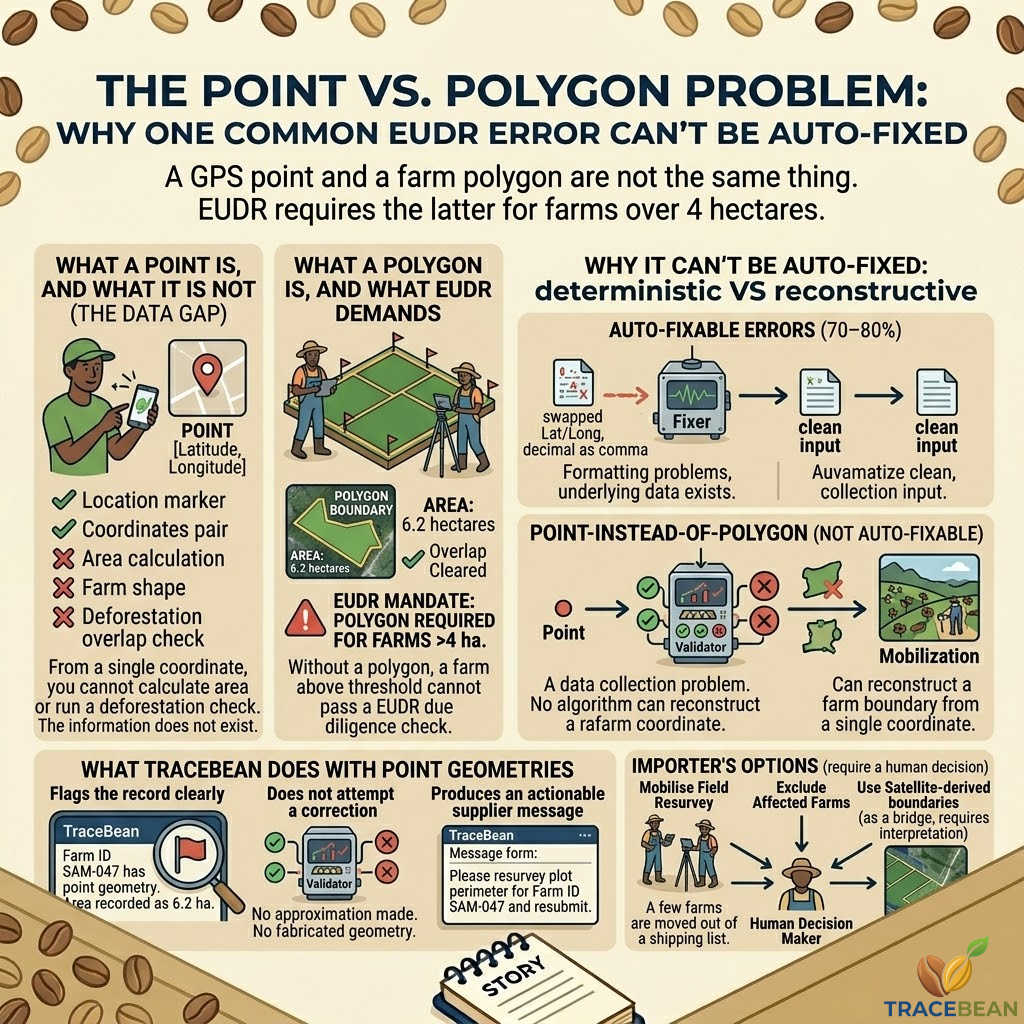
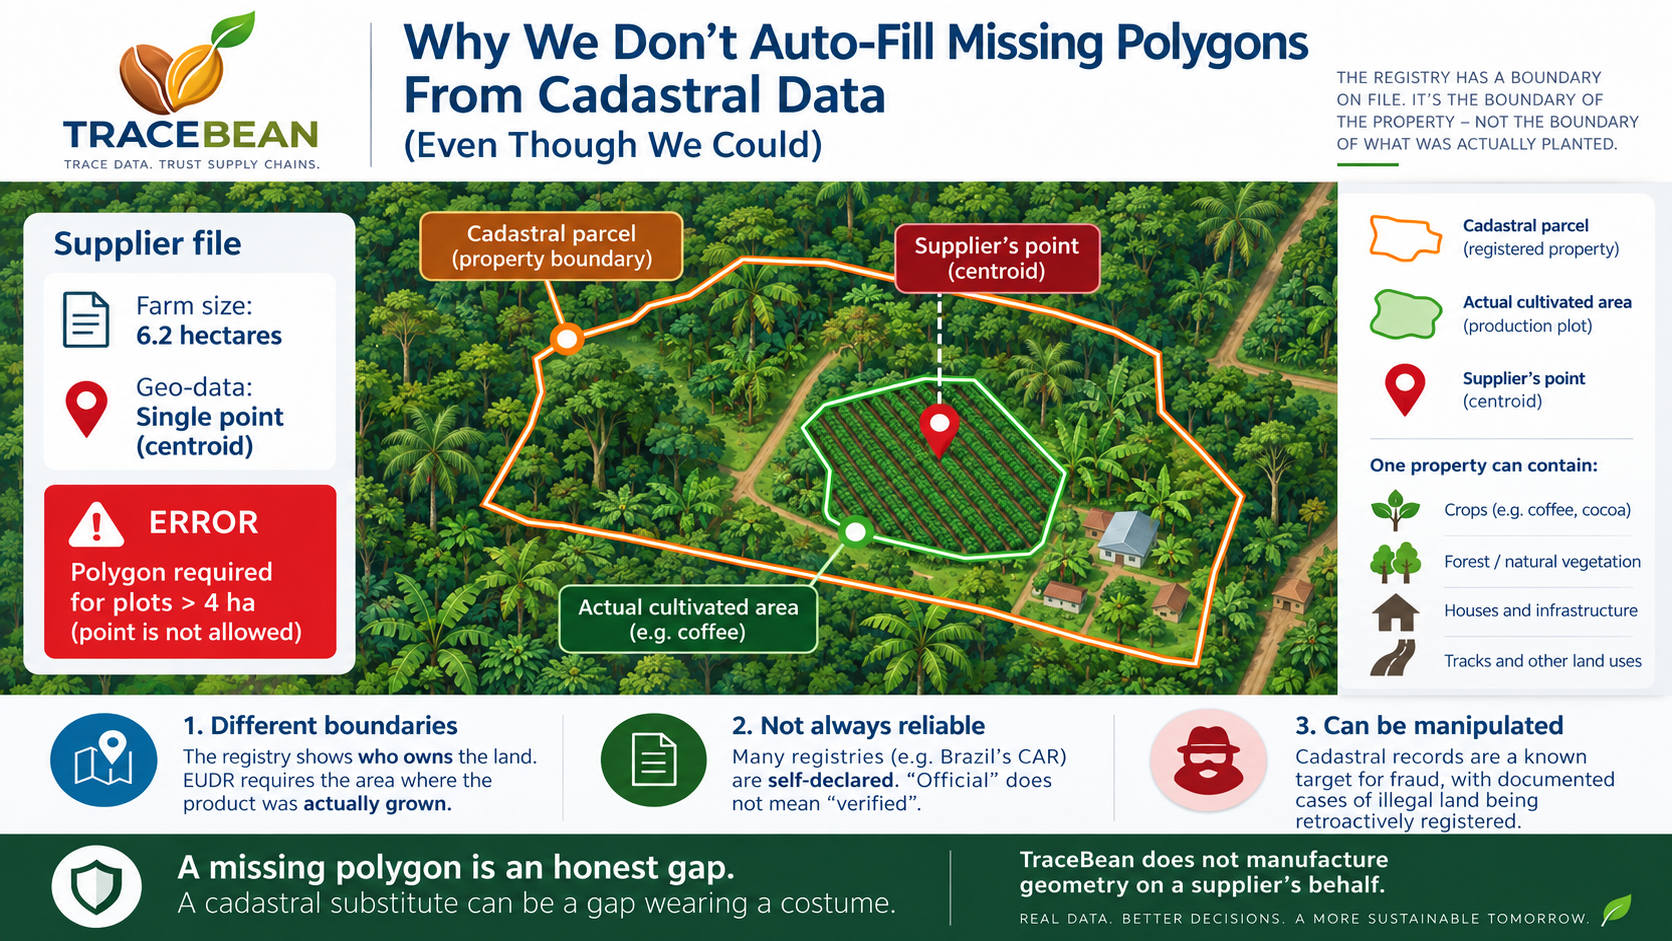
The Point vs. Polygon Problem: Why One Common EUDR Error Can't Be Auto-Fixed

A GPS point and a farm polygon are not the same thing. For EUDR compliance, that distinction matters more than most importers realise — and no software can bridge the gap.

Why thousands of smallholder farms make EUDR data quality harder, not easier.

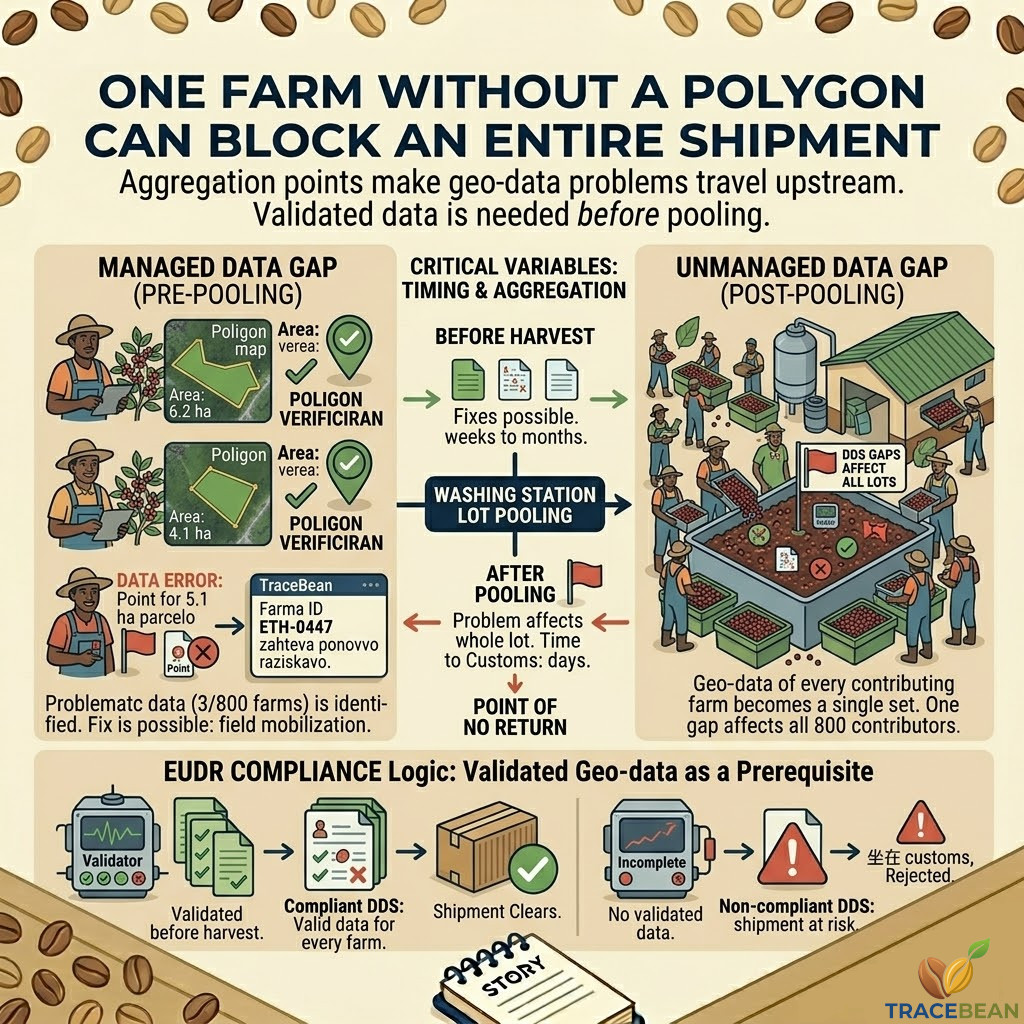
One Farm Without a Polygon Can Block an Entire Shipment

In coffee supply chains, geo-data problems don't stay at the farm level. They travel upstream — and surface at the worst possible moment.

Washing station pooling and EUDR compliance

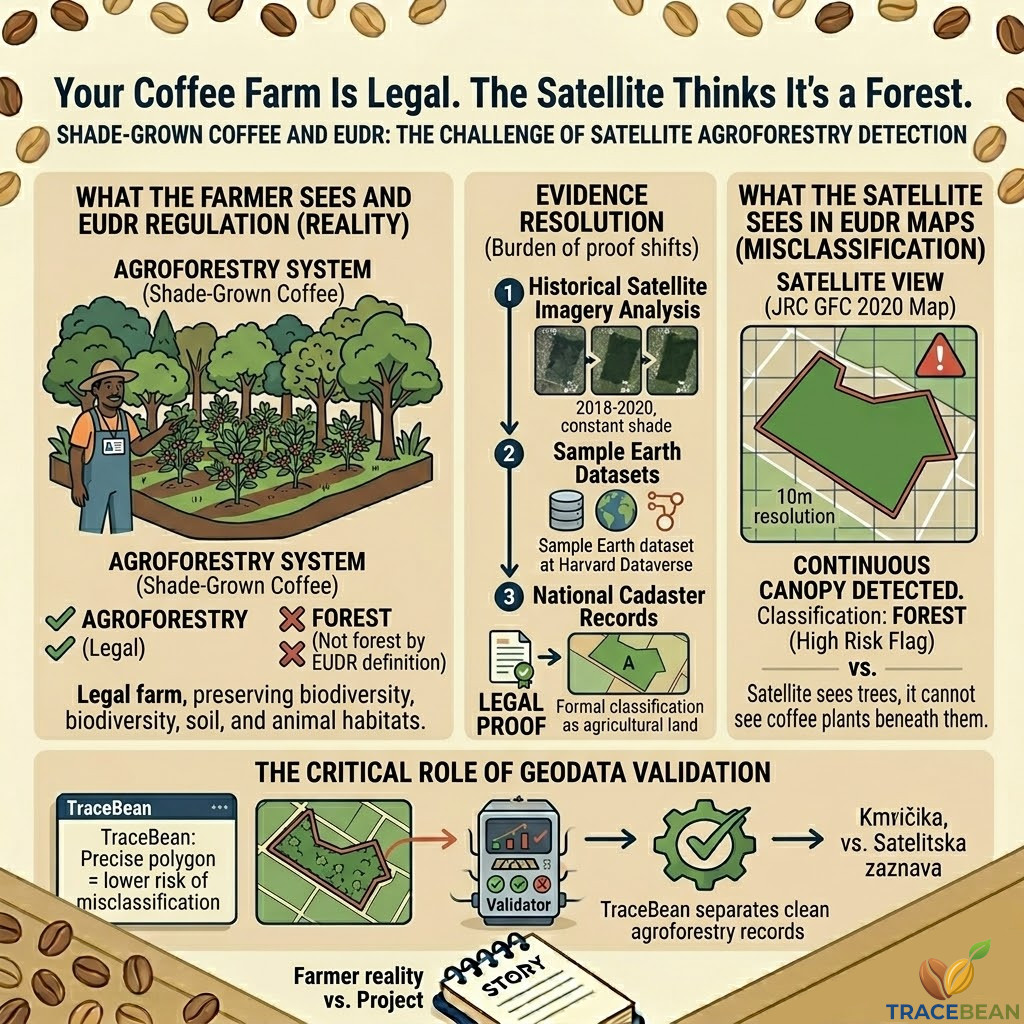
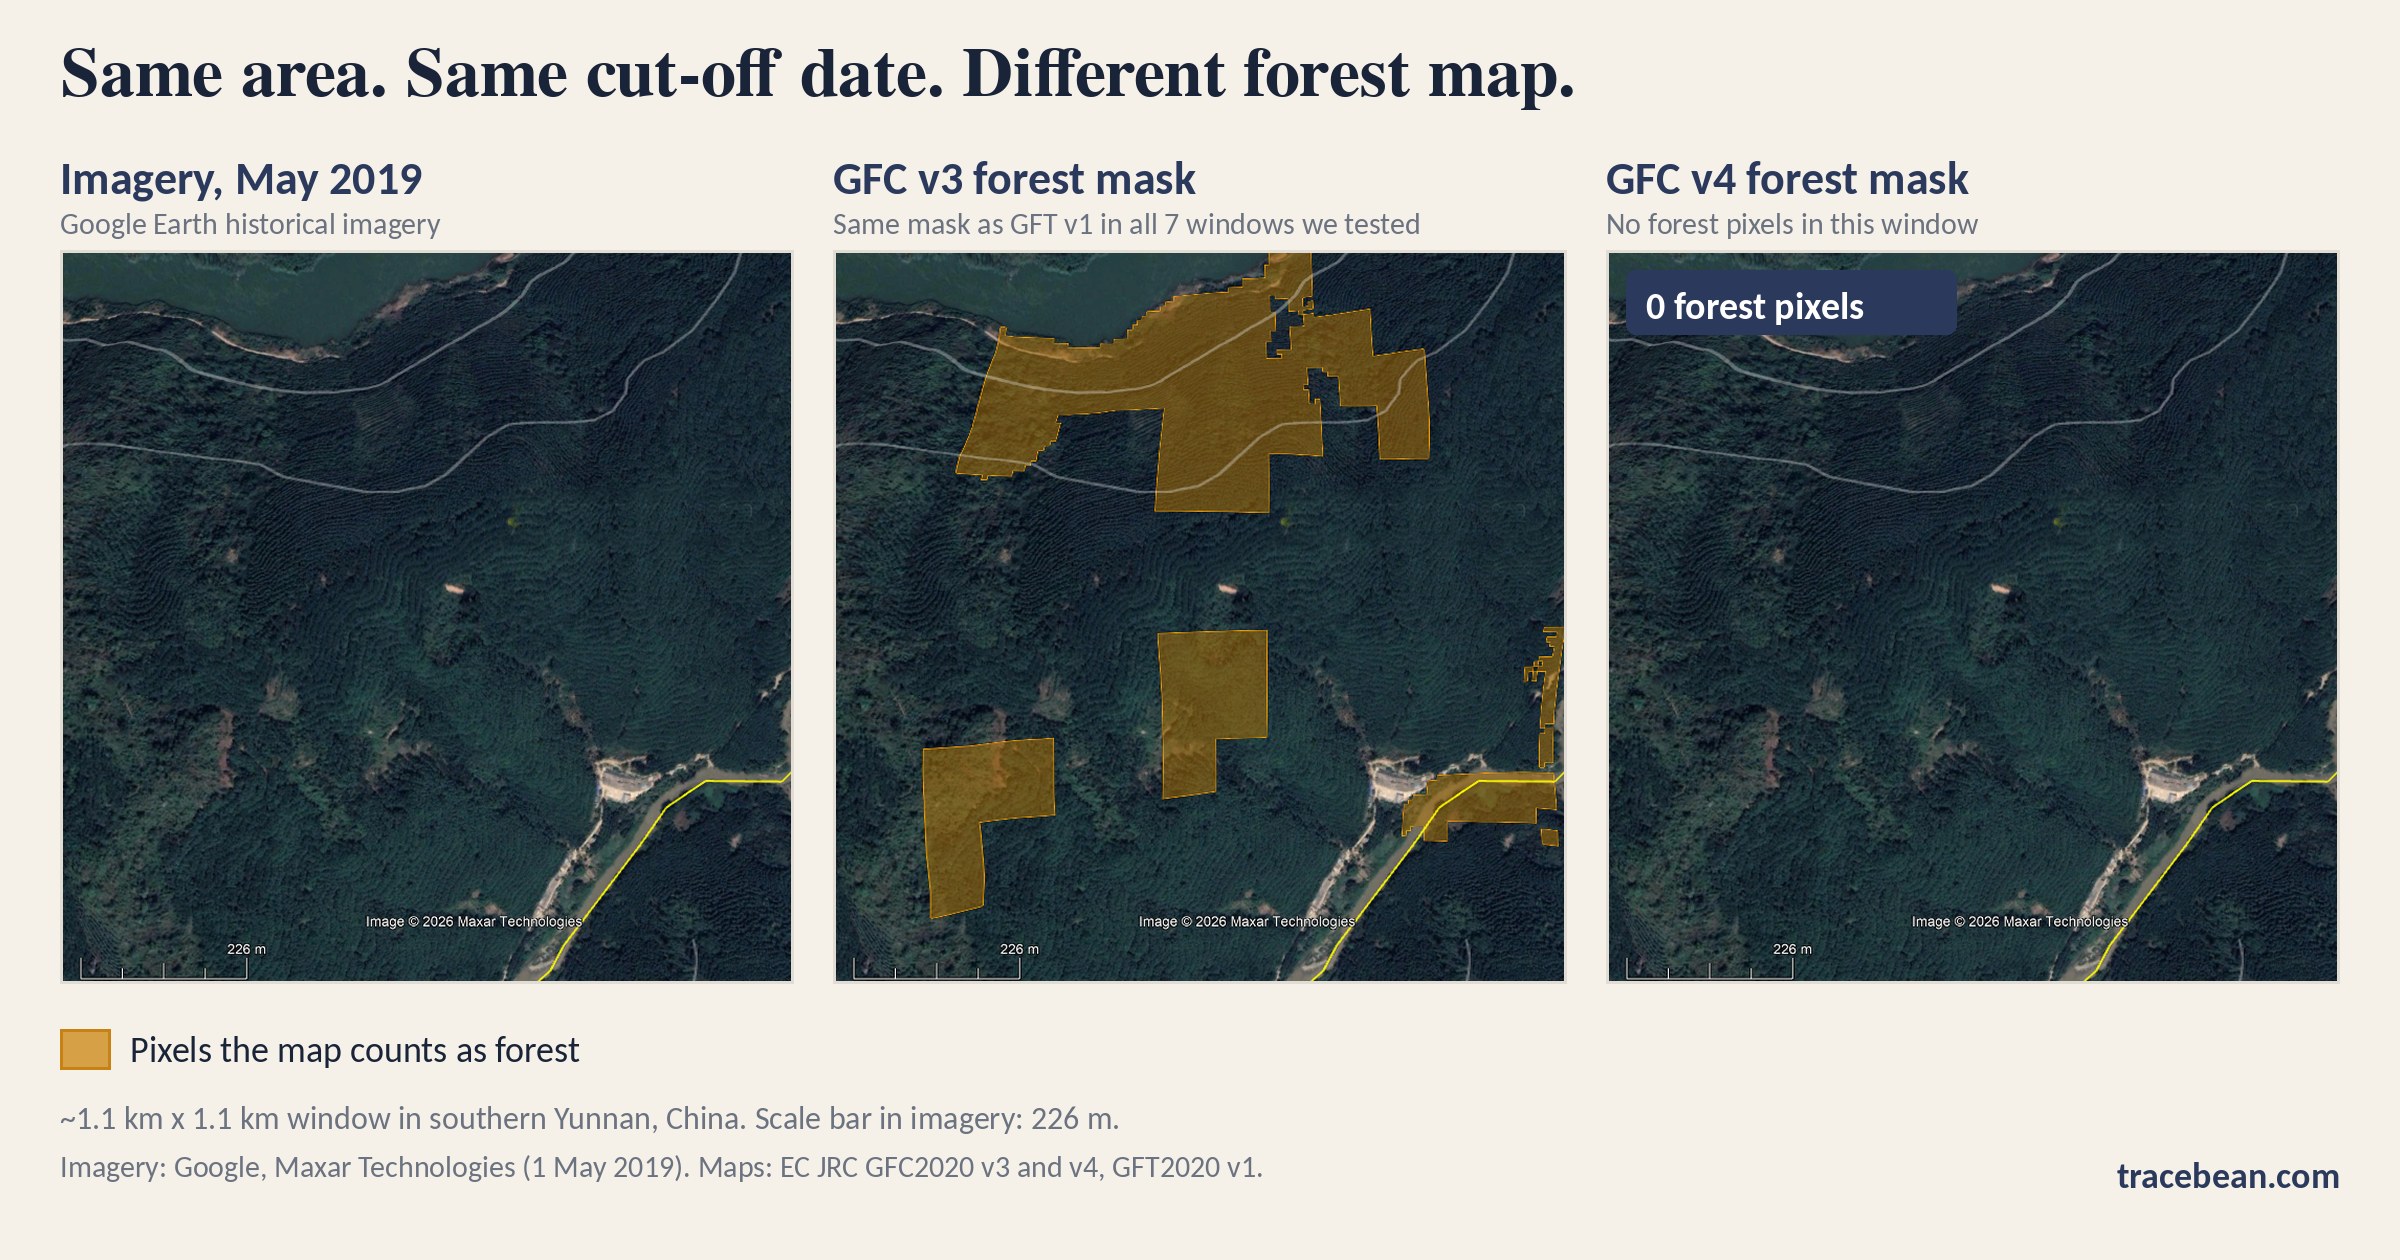
Your Coffee Farm Is Legal. The Satellite Thinks It's a Forest.

Agroforestry is explicitly excluded from EUDR's definition of forest. The satellite maps used to enforce the regulation don't always know the difference — and the numbers are alarming.

Agroforestry coffee under shade trees — EUDR satellite misclassification

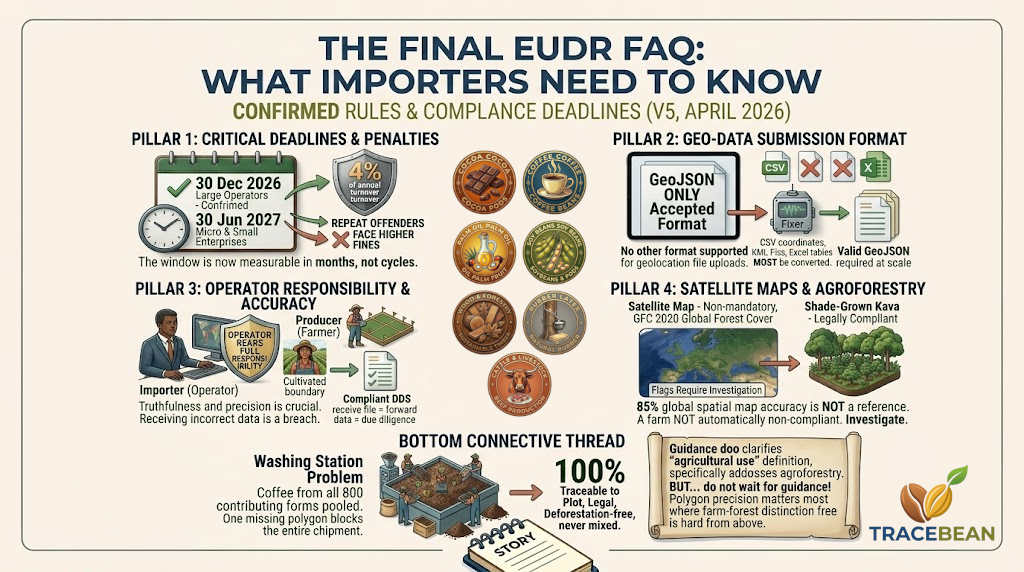
The EU Just Published Its Final EUDR FAQ. Here Is What Importers Need to Know.

Version 5 of the EUDR implementation FAQ was released in April 2026. The Commission has closed the door on further delays and further rewrites. Here is what changed — and what it means for green coffee importers working against the December deadline.

Agroforestry coffee under shade trees — EUDR satellite misclassification

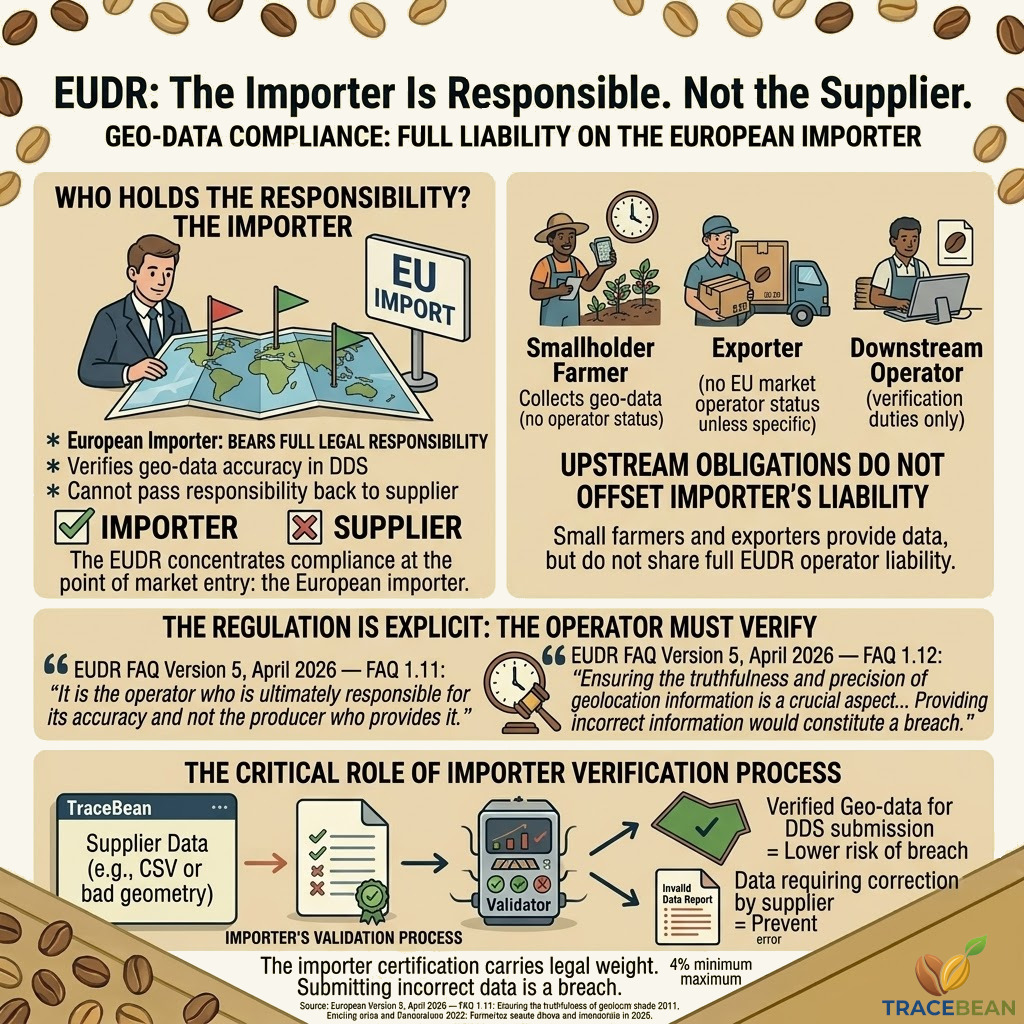
Under EUDR, the Importer Is Responsible. Not the Supplier.

EUDR places full compliance responsibility on the operator — the European importer. Not on the producer. Not on the exporter. Understanding what that means in practice changes how you should think about supplier geo-data.

EUDR operator responsibility — the importer bears full compliance responsibility

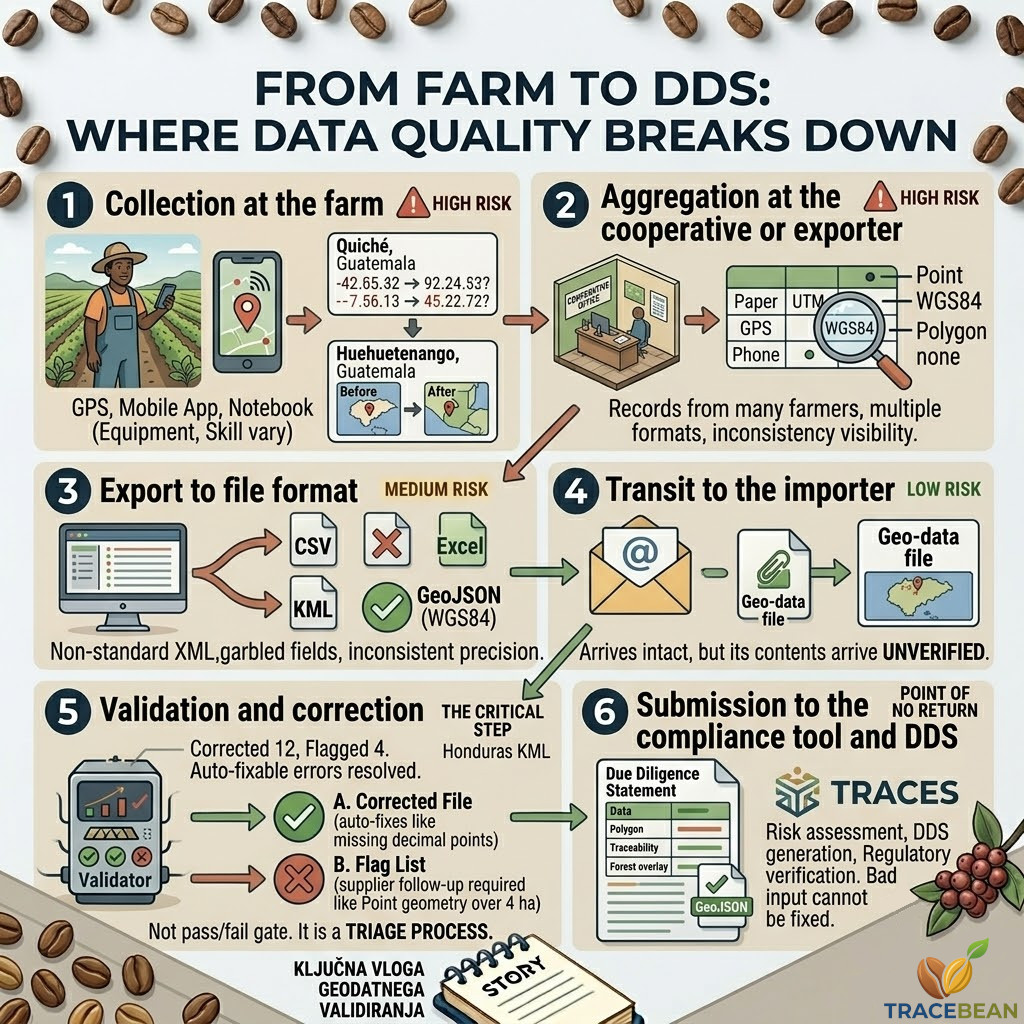
From Farm to DDS: Where Data Quality Breaks Down

A green coffee importer's geo-data travels through six distinct stages before it becomes a Due Diligence Statement. Problems can enter at every one of them — and most are invisible until someone checks.

From farm to DDS — where geo-data quality breaks down across the supply chain

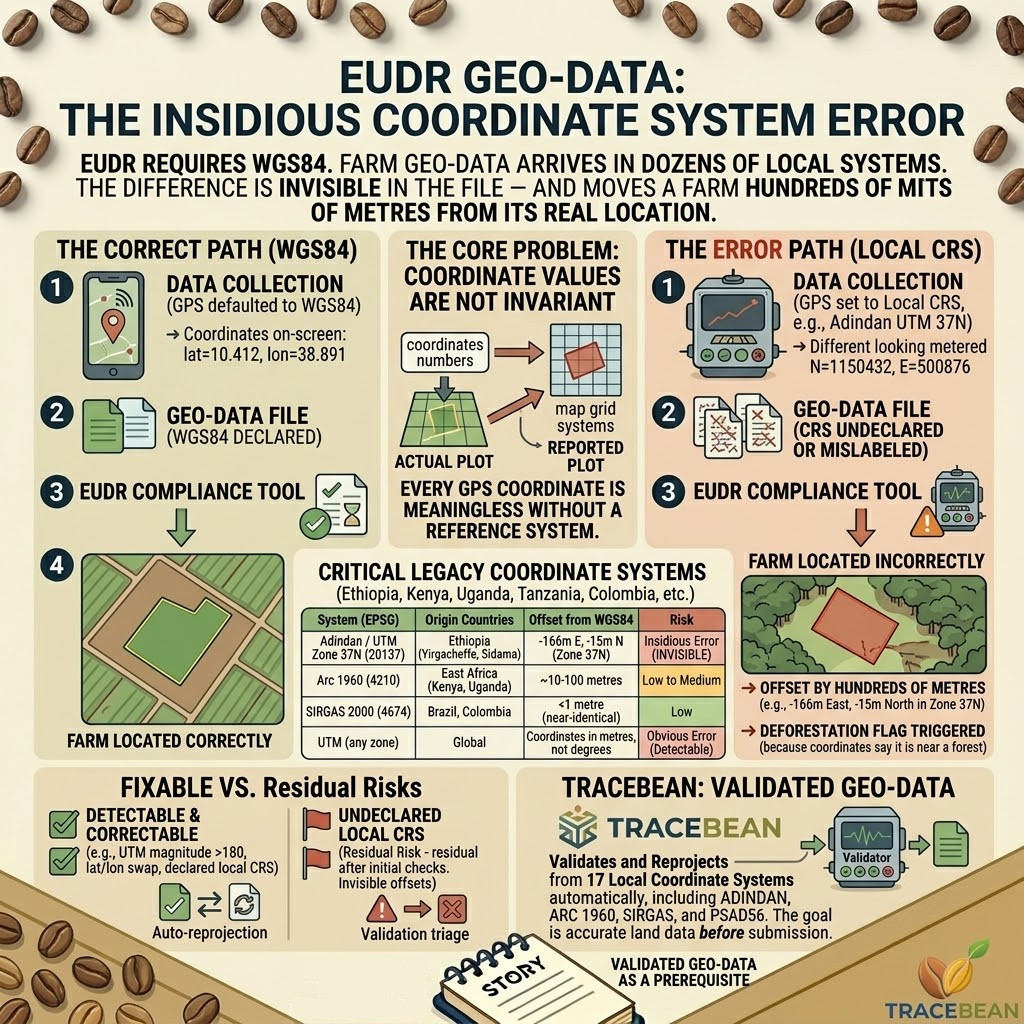
Your Farm Is in Ethiopia. Your Coordinates Say Otherwise.

EUDR requires WGS84. Farm geo-data arrives in dozens of local coordinate systems. The difference is invisible in the file — and can move a farm hundreds of metres from its real location.

Coordinate system errors in EUDR farm geo-data — WGS84 vs local projections

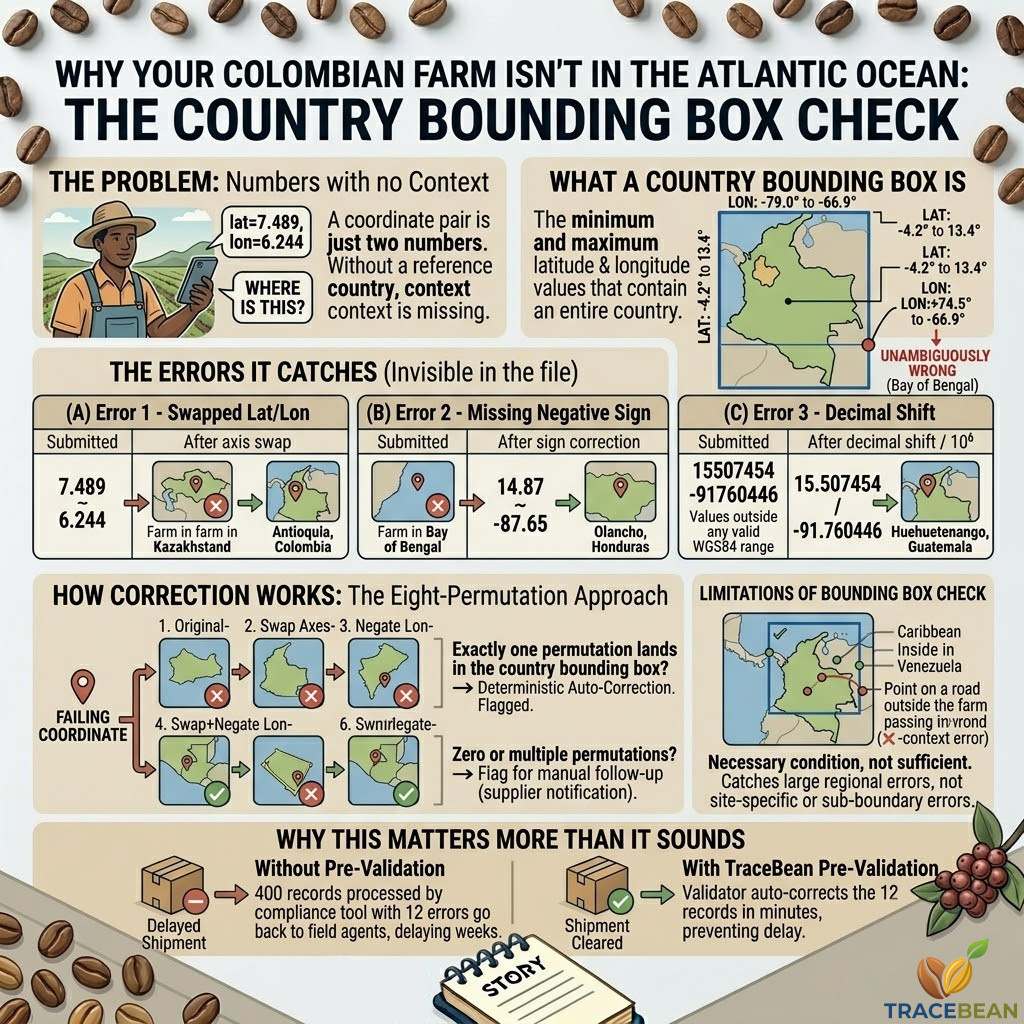
The Farm Is in Colombia. The Coordinates Are in the Atlantic Ocean.

A country bounding box check is the simplest sanity test in geo-data validation. It is also the test that catches errors no other check can find — because the coordinate looks completely normal until you ask where it actually is.

Country bounding box check — farm coordinates outside expected country boundary

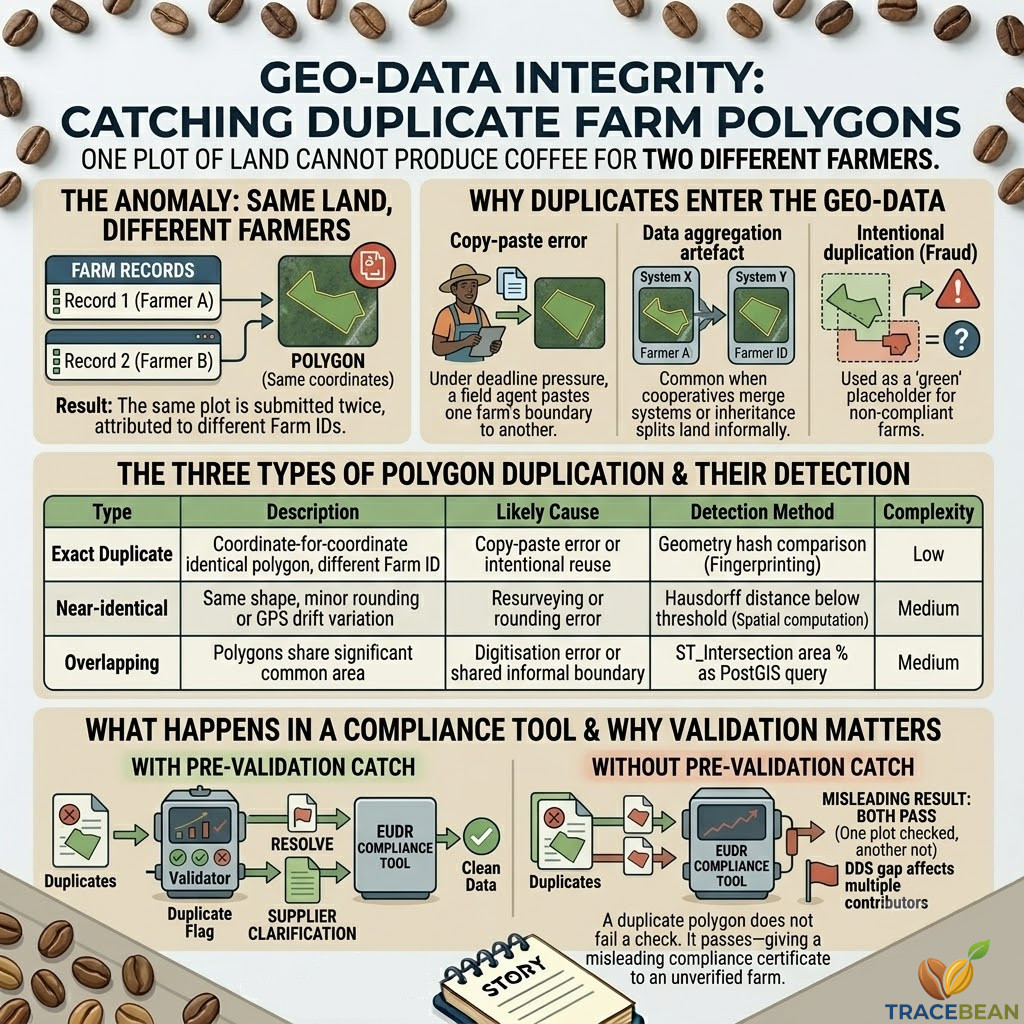
The Same Plot of Land Cannot Produce Coffee for Two Different Farmers. But Your Geo-Data Says It Does.

Duplicate farm polygons are more common than most importers realise. They are not always fraud. But they are always a problem — for data integrity, for deforestation checks, and for EUDR compliance.

Duplicate farm polygons in EUDR geo-data — data integrity problem

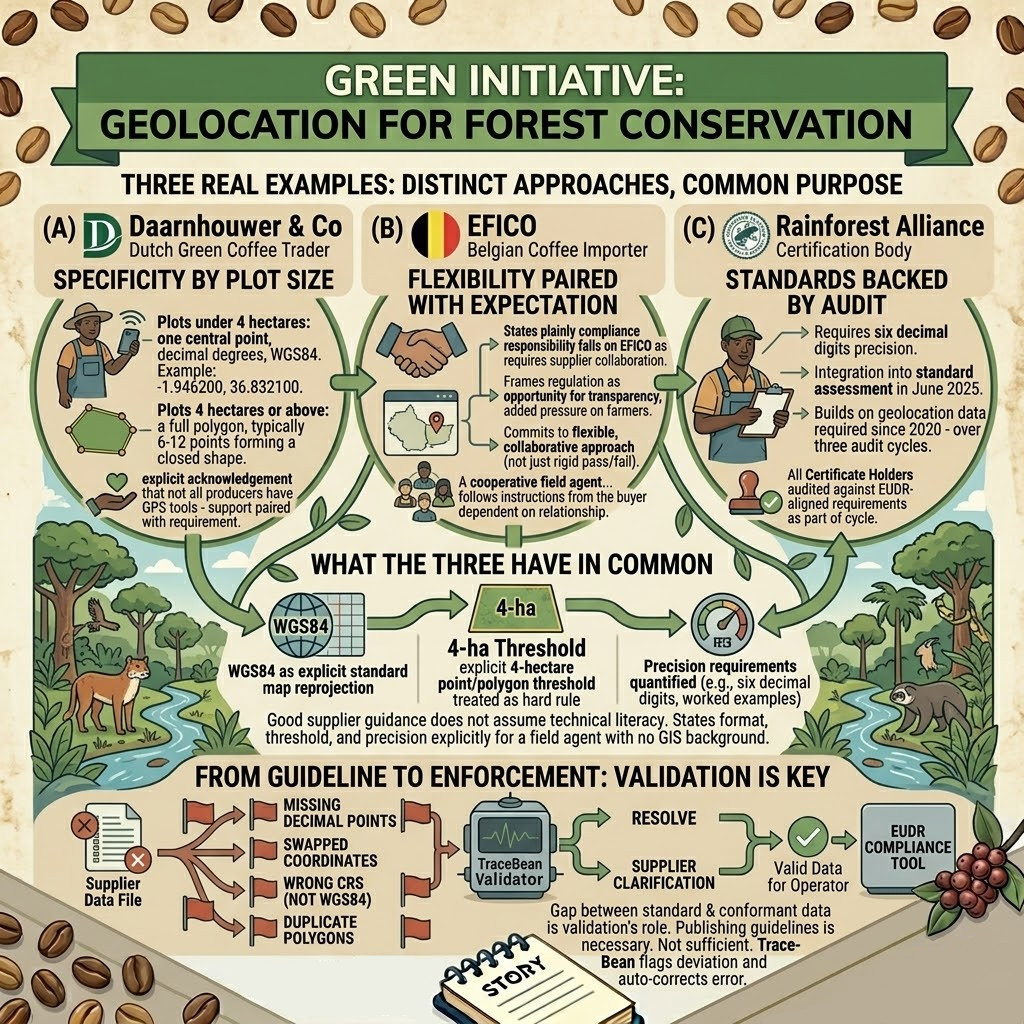
What Good Supplier Guidelines Look Like — Three Real Examples

Daarnhouwer, EFICO, and the Rainforest Alliance have each published their own geo-data requirements for suppliers. Comparing the three reveals what good guidance looks like — and what no guideline can do on its own.

Comparing supplier geo-data guidelines from Daarnhouwer, EFICO, and Rainforest Alliance

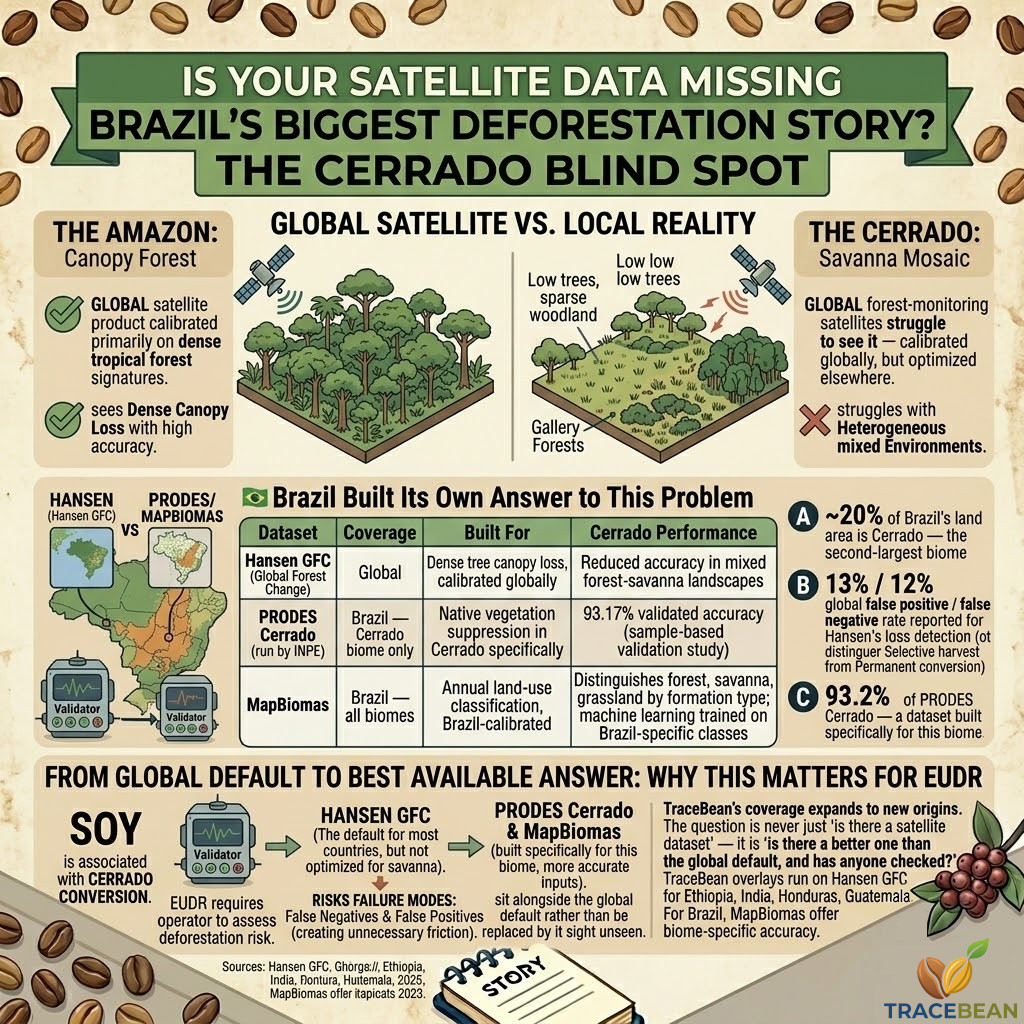
Is It Possible Your Satellite Data Is Missing Brazil's Biggest Deforestation Story?

The Cerrado is Brazil's second-largest biome and the engine behind much of its agricultural expansion. Global forest-monitoring satellites struggle to see it — because it was never built to look like a forest in the first place.

Brazilian Cerrado savanna versus Amazon rainforest in satellite deforestation monitoring

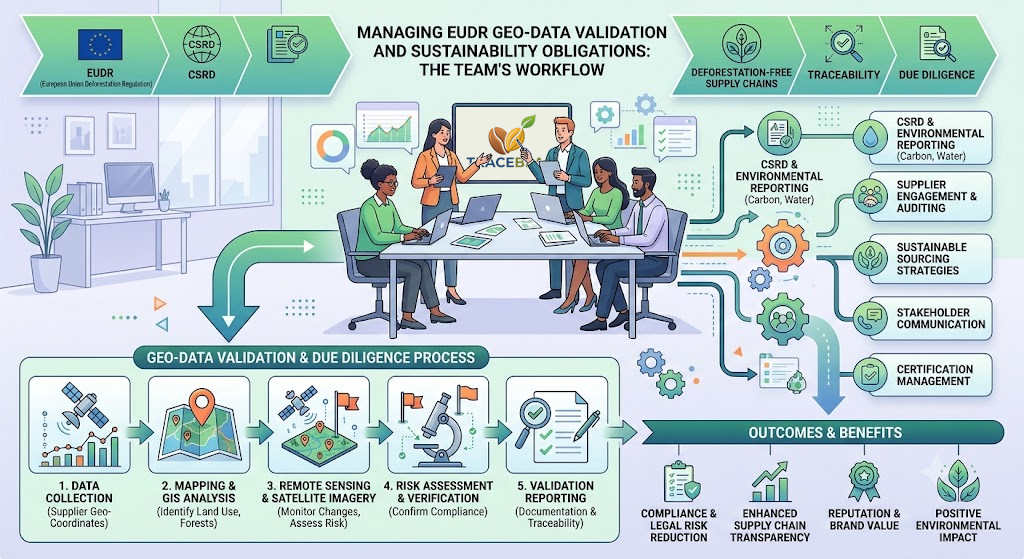
Your Sustainability Team Is Managing More Than EUDR. Geo-Data Doesn't Have to Be Part of That Pile.

EUDR rarely sits alone on a sustainability team's desk. It sits in a pile with everything else competing for the same hours. Geo-data validation is one of the few items in that pile that can actually be handed off.

Sustainability team managing multiple EU regulations alongside EUDR

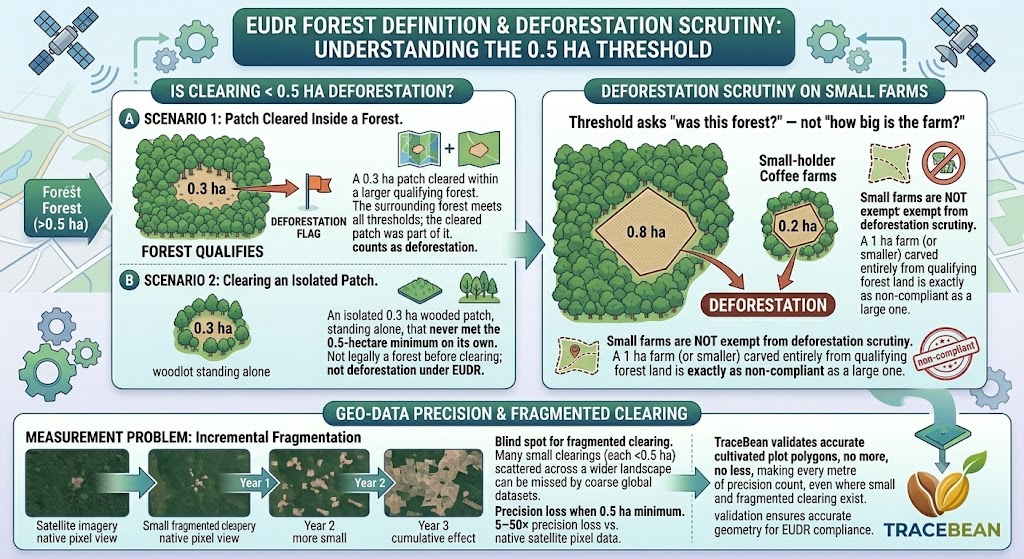
Is It Possible That Clearing Less Than Half a Hectare Doesn't Count as Deforestation?

EUDR's forest definition has a built-in minimum size: 0.5 hectares. Below that, land isn't legally a forest, however dense the trees. What that means for smallholder farms — and for clearing that happens in pieces too small for any single check to catch.

EUDR 0.5 hectare forest definition threshold and smallholder farms

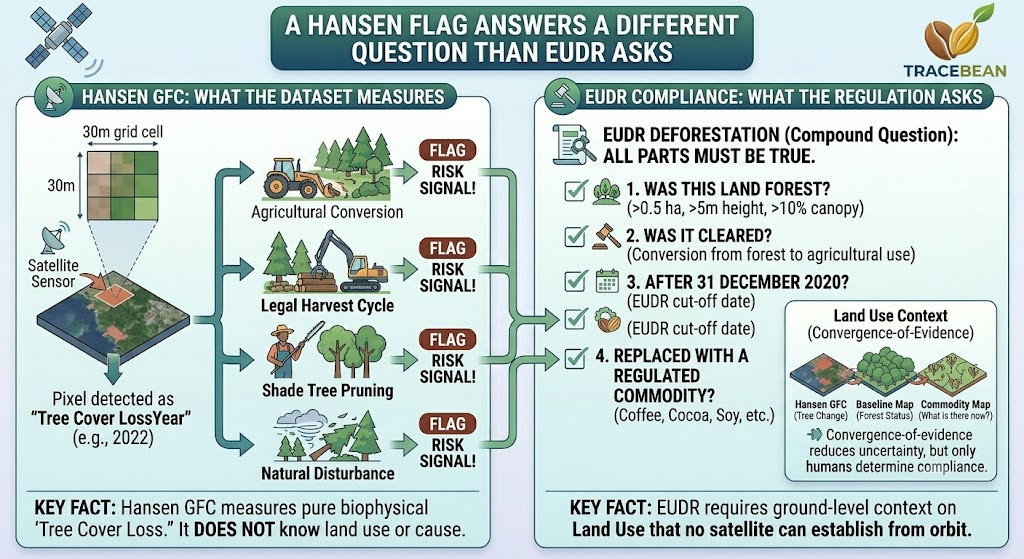
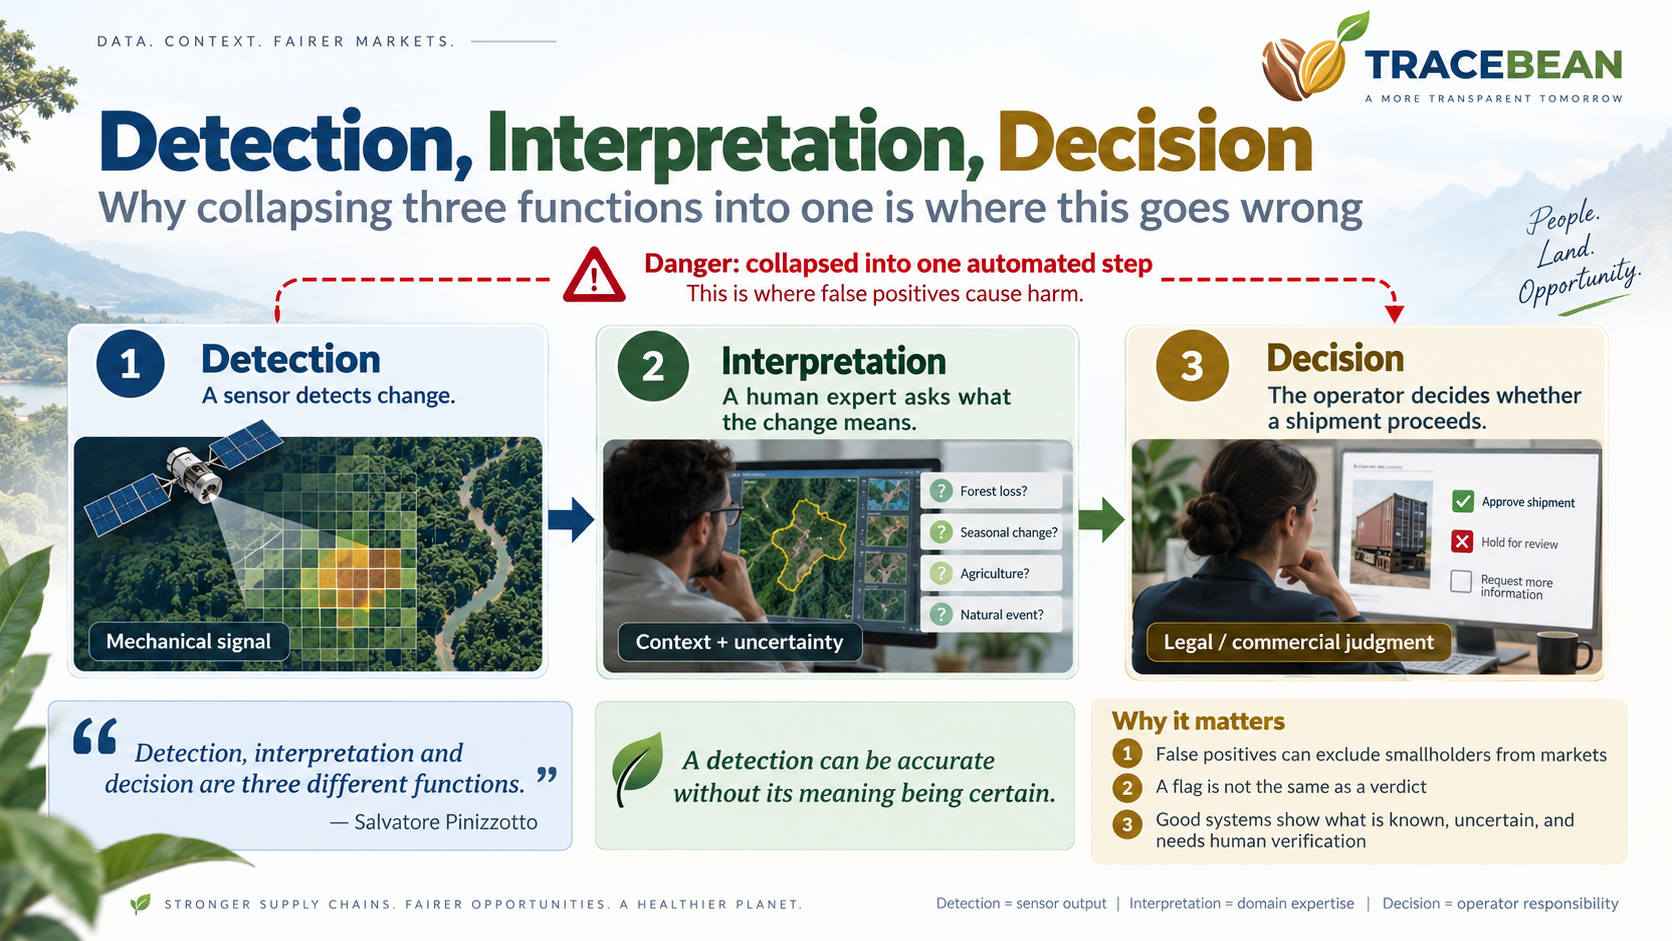
A Hansen Flag Answers a Different Question Than EUDR Asks

Hansen Global Forest Change measures tree cover loss. EUDR asks whether forest was cleared and replaced with a regulated commodity after 31 December 2020. These are not the same question — and treating them as interchangeable is the most common mistake in EUDR deforestation screening.

Hansen tree cover loss signal versus EUDR deforestation definition

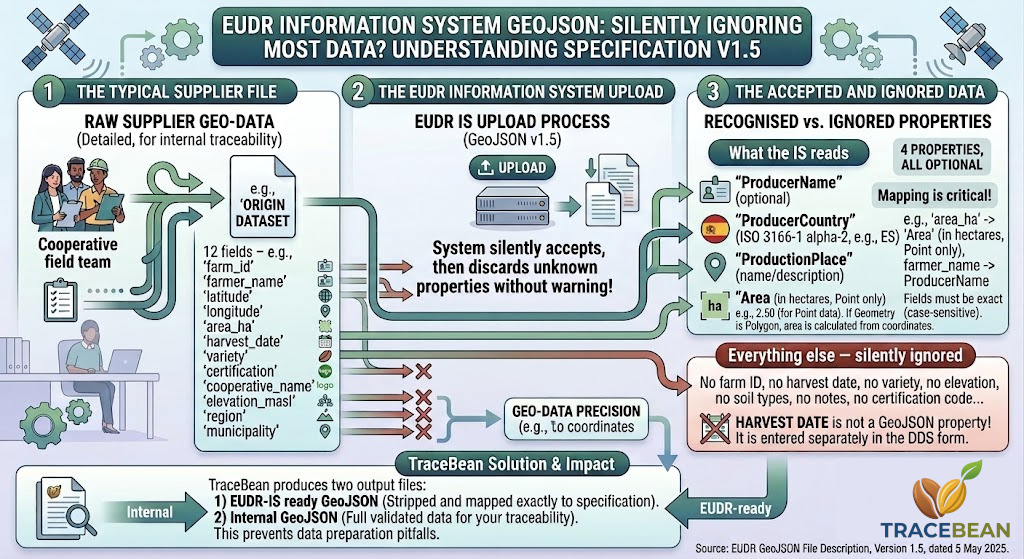
Is It Possible the EUDR Information System Ignores Most of What Your Supplier Sent You?

The EUDR Information System accepts exactly four optional GeoJSON properties. Everything else in your supplier's file — farm name, farmer ID, harvest date, variety, certification status — is silently ignored on upload.

EUDR Information System accepts four GeoJSON properties, everything else ignored

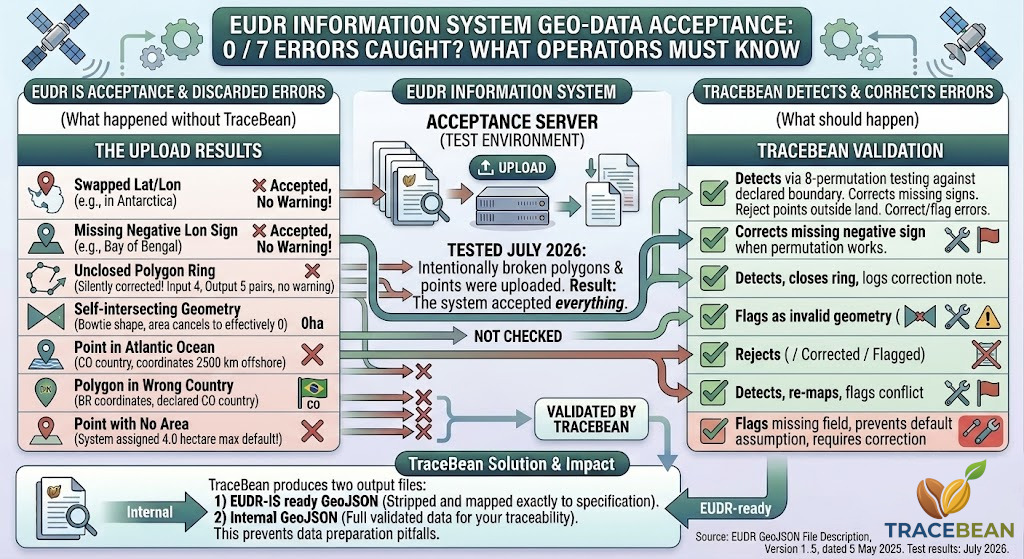
We Uploaded Eight Broken Farm Polygons to the EUDR Information System. It Accepted All of Them.

We tested the EUDR Information System acceptance server with swapped coordinates, polygons in the wrong country, a farm in the Atlantic Ocean, and a self-intersecting geometry. The system accepted every one without warning or error.

Eight broken polygons accepted by EUDR Information System without warning

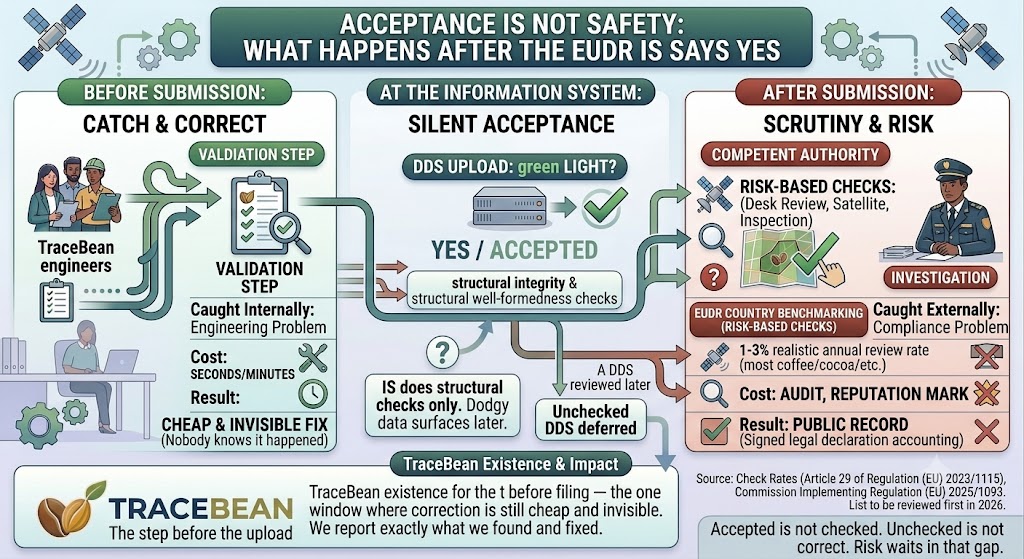
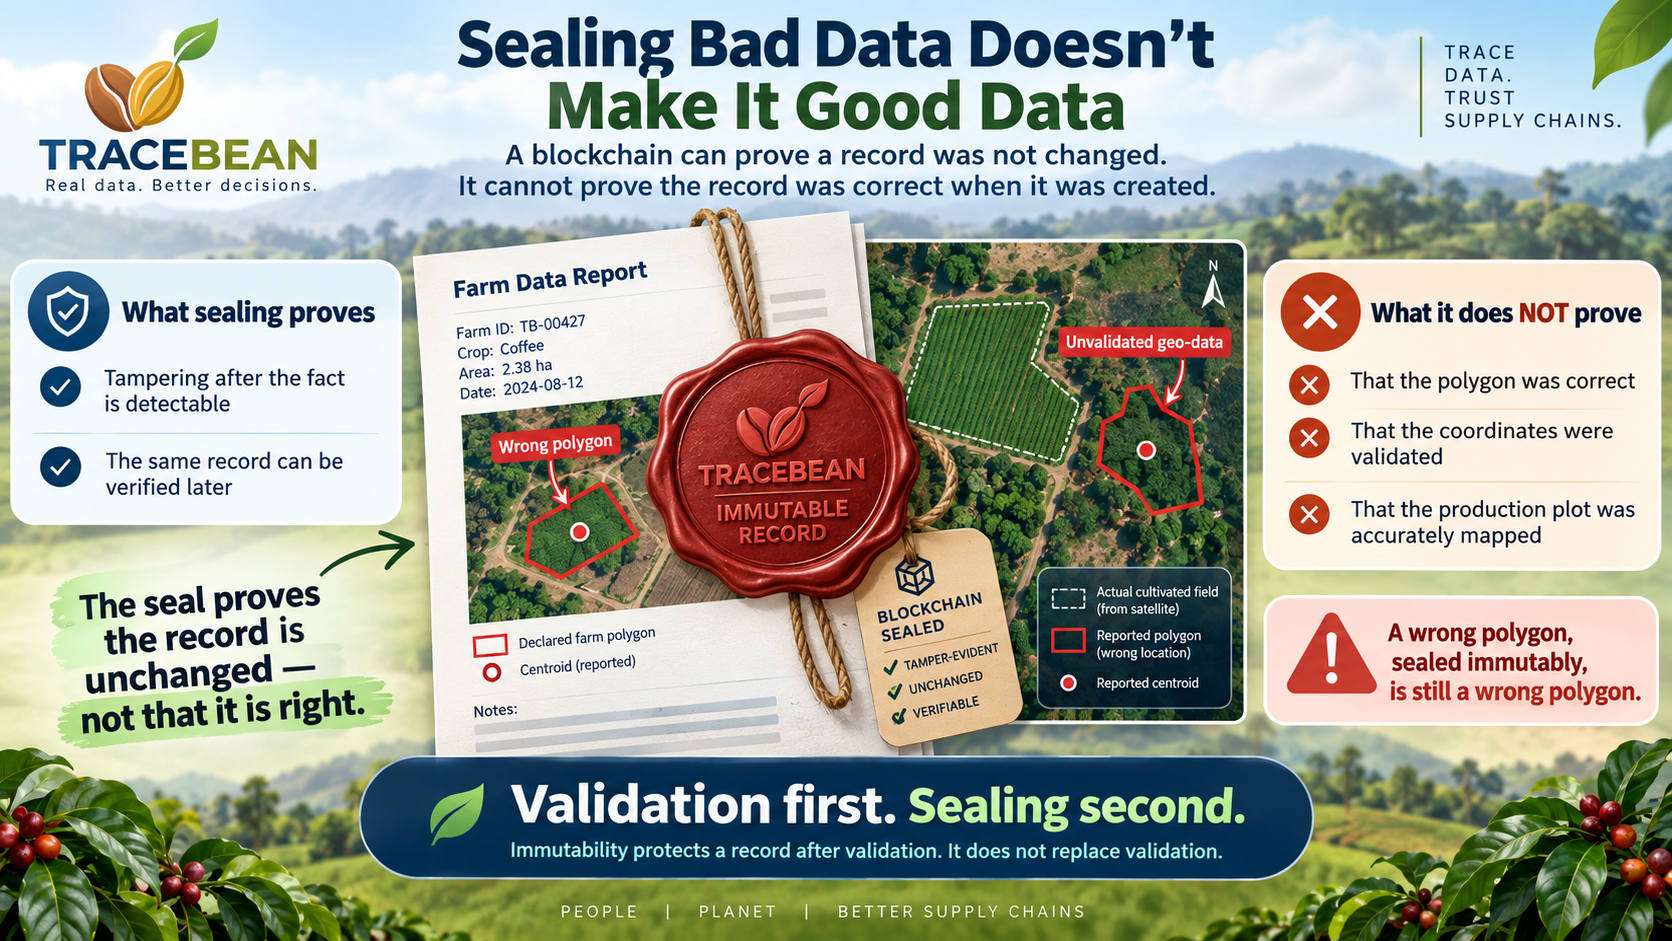
Acceptance Is Not Safety: What Happens After the EUDR Information System Says Yes

A reply to our last post made a fair point: competent authorities will eventually catch bad geo-data. That's true. It's also exactly why validation has to happen before submission — not after.

Same underlying error, two different moments of discovery — and two entirely different cost categories.

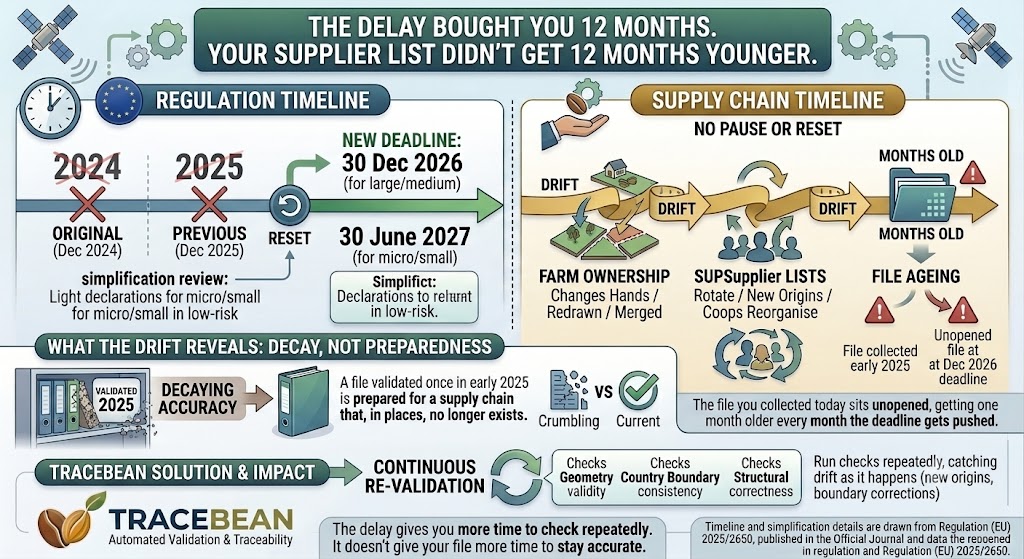
The Delay Bought You 12 Months. Your Supplier List Didn't Get 12 Months Younger.

EUDR has been postponed again. Nearly every compliance platform is telling you the same thing: don't get complacent. True, but incomplete — it isn't complacency that's the risk. It's what happens to your supplier data while you wait.

Timeline showing the EUDR application date moved to December 2026, with supplier farm data continuing to change underneath it

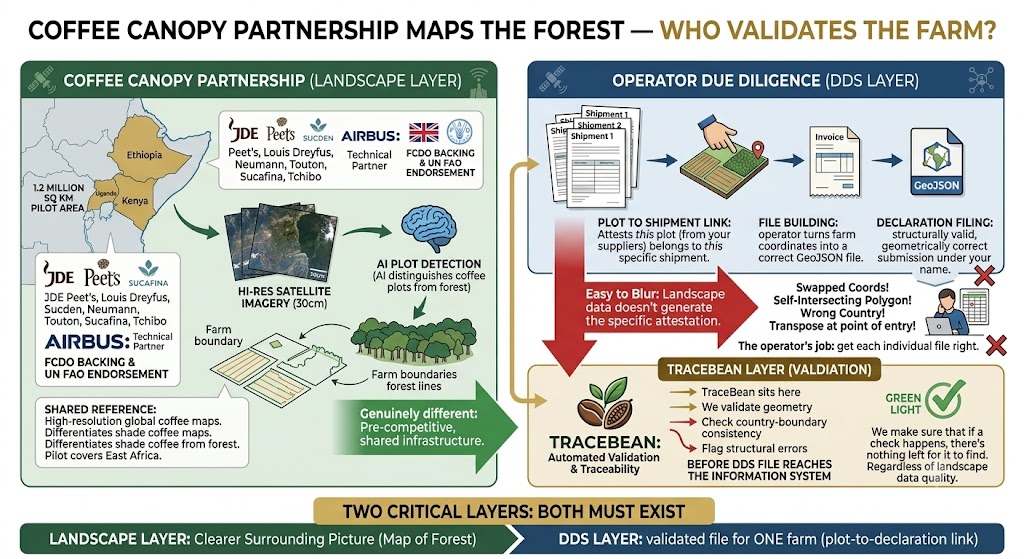
Coffee Canopy Partnership Maps the Forest — Who Validates the Farm?

Seven of the world's largest coffee traders and roasters just built something the industry needed: a shared, high-resolution view of deforestation risk across entire coffee landscapes. It's a genuinely different problem from the one that sits underneath every individual DDS — and worth being precise about which is which.

Diagram contrasting a landscape-scale coffee deforestation risk map with a single farm's DDS geolocation submission

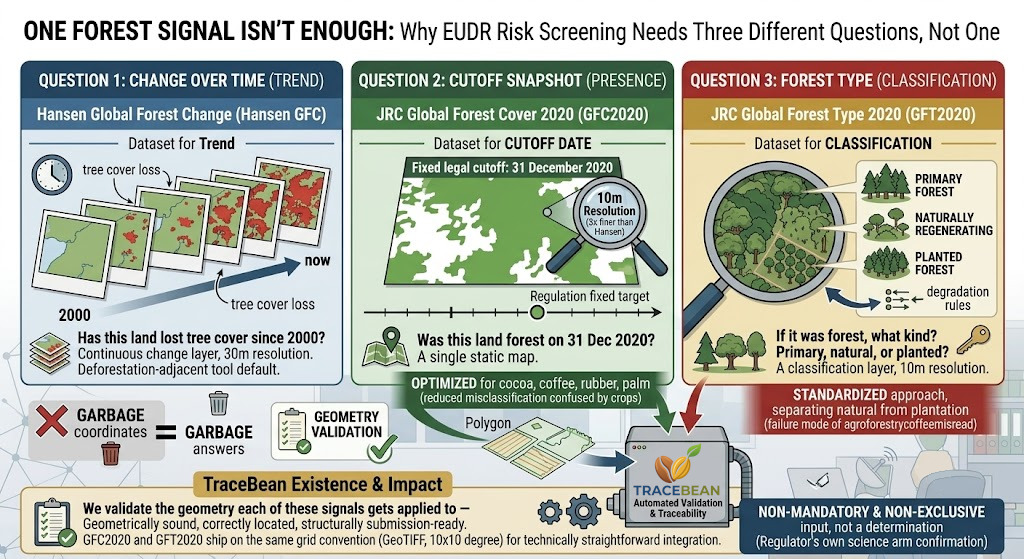
One Forest Signal Isn't Enough: Why EUDR Risk Screening Needs Three Different Questions, Not One

Hansen Global Forest Change, JRC's GFC2020 and GFT2020 all get filed under "the deforestation dataset." They're not versions of the same thing — they answer three different questions, and mixing them up is easy to do and expensive to get wrong.

Diagram comparing Hansen Global Forest Change, JRC GFC2020, and JRC GFT2020 as three different forest-risk questions

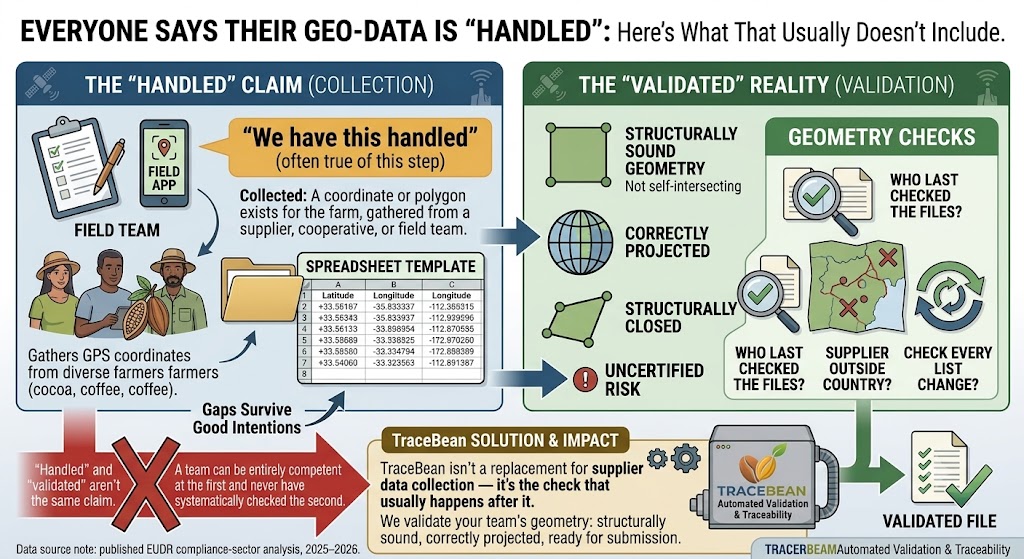
Everyone Says Their Geo-Data Is "Handled." Here's What That Usually Doesn't Include.

It's the most common response to any conversation about farm geo-data readiness — and it's usually true. It's also usually answering a narrower question than the one that determines whether a DDS actually gets accepted.

Diagram splitting geo-data readiness into two separate claims: collected and validated

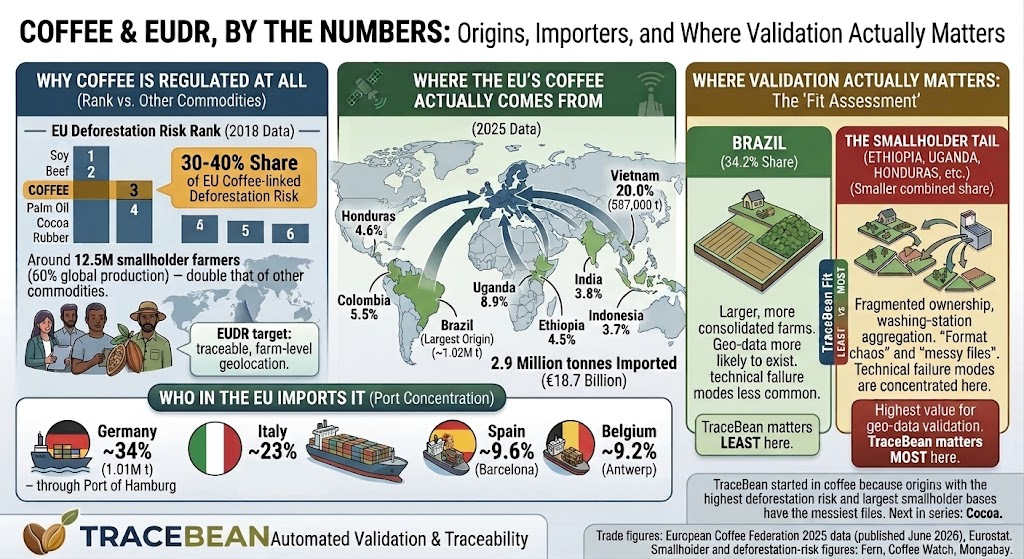
Coffee and EUDR, By the Numbers: Origins, Importers, and Where Validation Actually Matters

First in a series looking at each of EUDR's seven commodities on its own terms — where the EU actually sources it, why it's regulated at all, and an honest read on where TraceBean's kind of work matters most.

Map and chart of EU coffee import origins and top EU importing countries

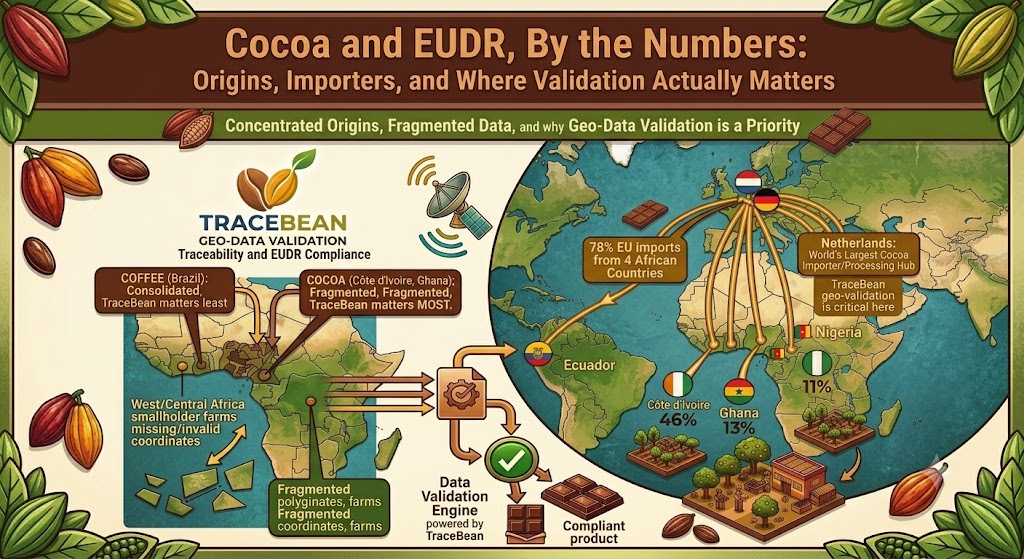
Cocoa and EUDR, By the Numbers: Origins, Importers, and Where Validation Actually Matters

Second in our commodity-profile series. Of the seven EUDR commodities, cocoa has one of the most direct, best-documented links to forest loss — and unlike coffee, there's no large consolidated origin to point to as the exception.

Map and chart of EU cocoa import origins and top EU importing countries

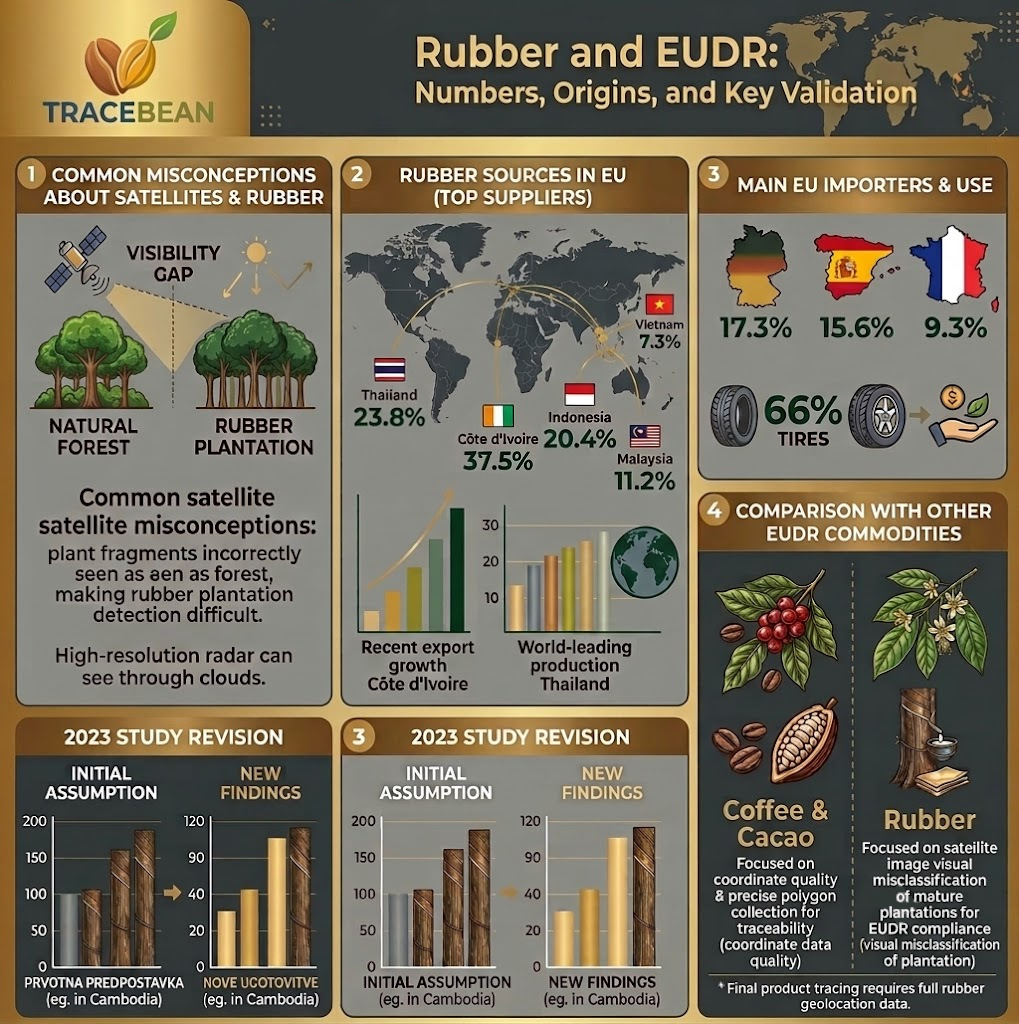
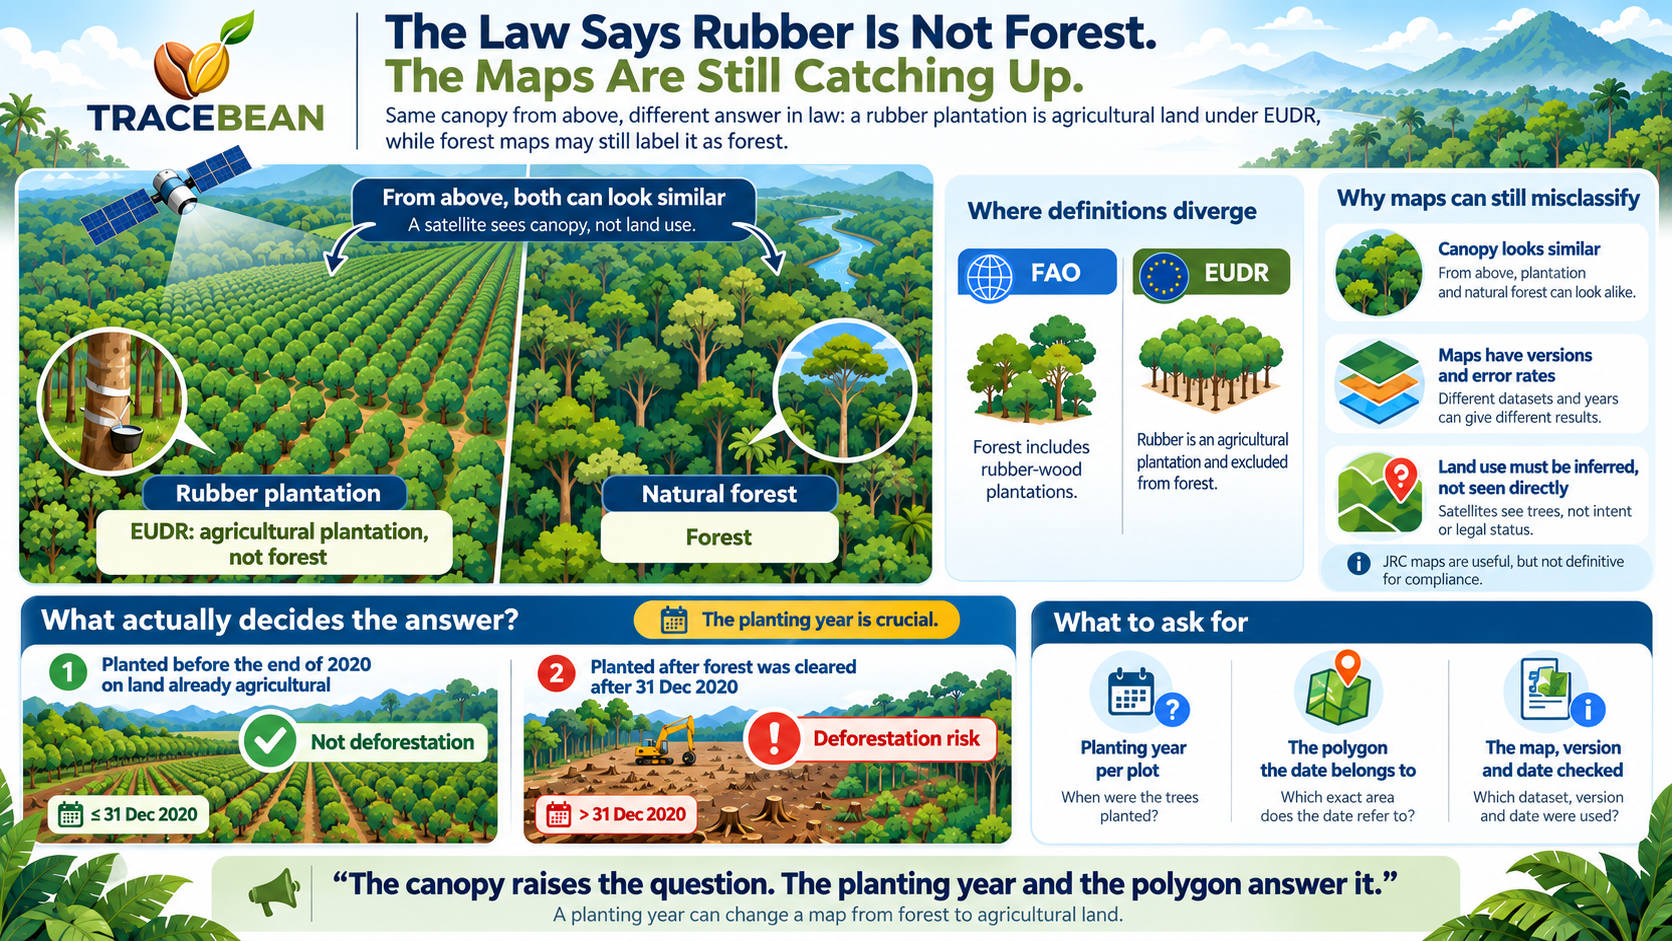
Rubber and EUDR, By the Numbers: Origins, Importers, and Where Validation Actually Matters

Third in our commodity-profile series. Rubber was nearly left out of EUDR altogether — and a 2023 study suggests that would have been a significant mistake.

Map and chart of EU cocoa import origins and top EU importing countries

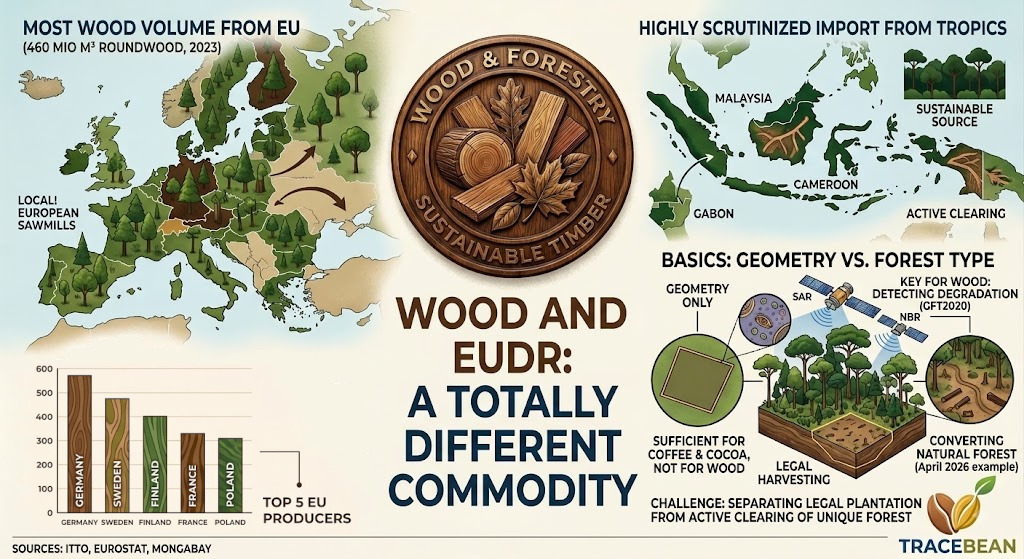
Wood and EUDR, By the Numbers: A Different Kind of Commodity Entirely

Fourth in our commodity-profile series. Unlike coffee, cocoa or rubber, most of the EU's wood is grown inside the EU. The real question isn't where the volume comes from — it's whether anyone can reliably tell legal harvesting from illegal clearing on the specific tropical share that does.

Comparison of EU domestic timber production versus tropical timber imports, and the deforestation-versus-degradation detection gap

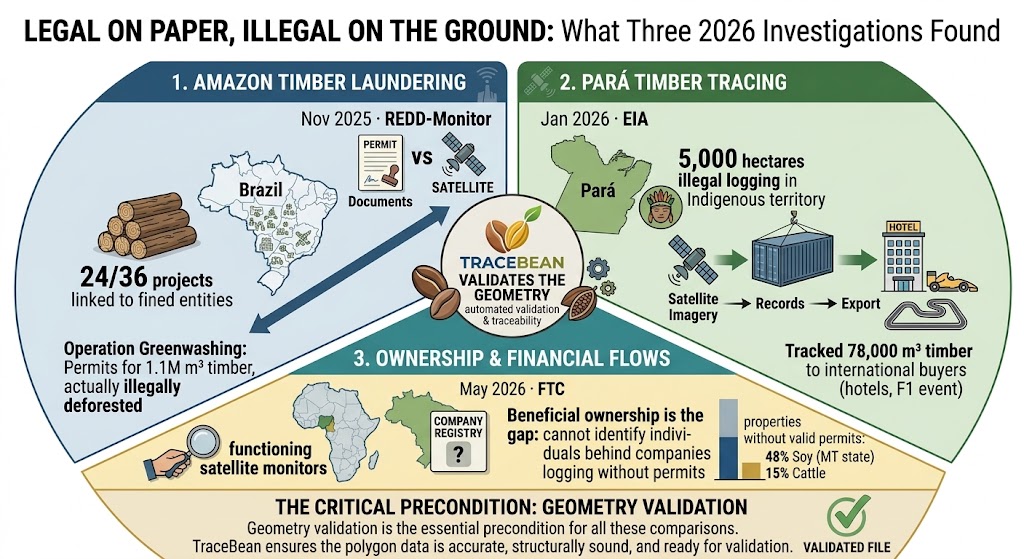
Legal on Paper, Illegal on the Ground: What Three 2026 Investigations Found

A valid permit, a registered concession, a certified plot — none of it guarantees the satellite agrees. Three unrelated investigations this year found the same gap, on two continents, across two different commodities.

Diagram showing a legal permit document next to a satellite image of active deforestation on the same land parcel

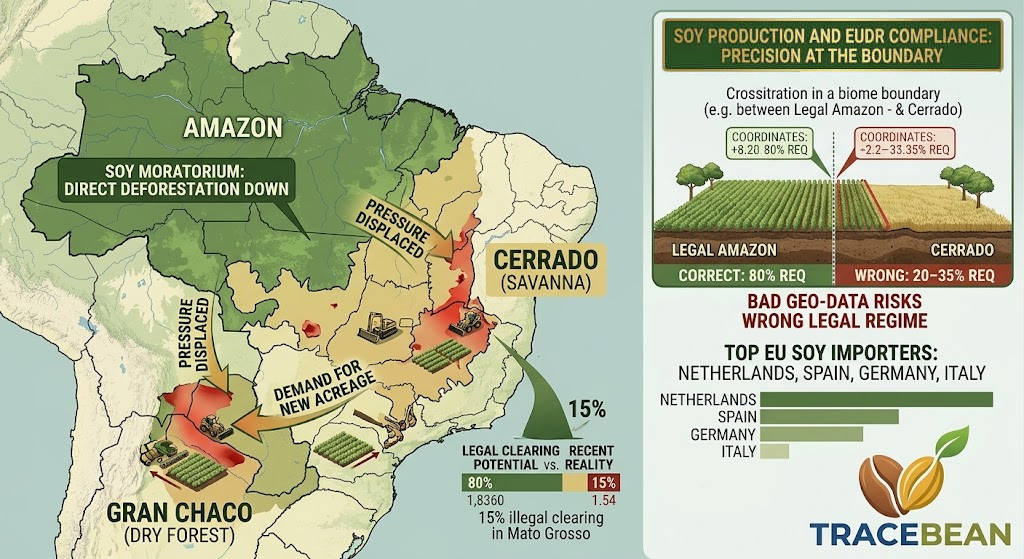
Soy and EUDR, By the Numbers: Two Frontiers, Not One Rainforest

Fifth in our commodity-profile series. Soy breaks every pattern the other four shared — industrial scale, not smallholder fragmentation. Its deforestation story doesn't sit in the Amazon anymore. It sits in a savanna and a dry forest most people have never heard of.

Map showing soy-driven deforestation pressure shifted from the Amazon into Brazil's Cerrado and the Argentina-Paraguay Gran Chaco

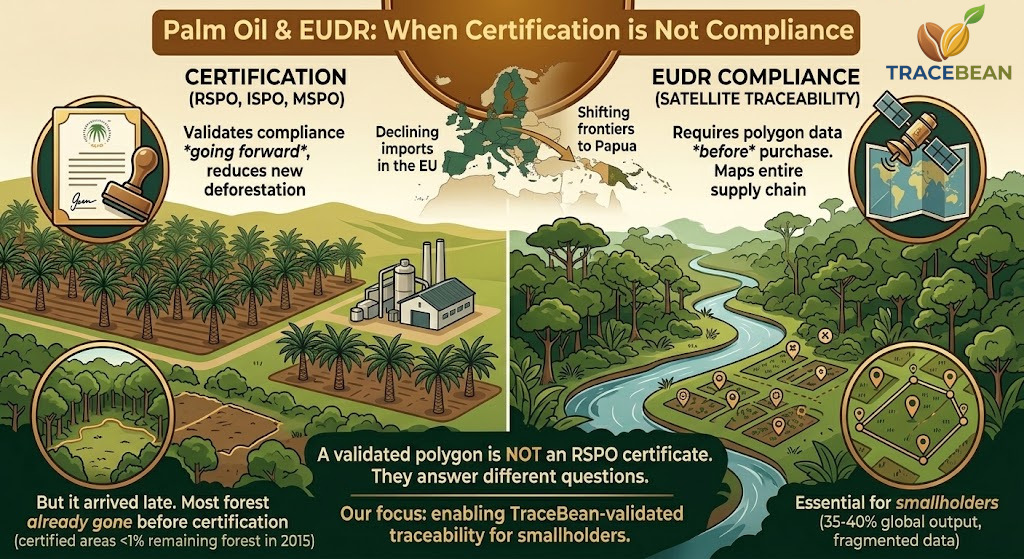
Palm Oil and EUDR, By the Numbers: Where Certification Isn't the Same as Compliance

Sixth in our commodity-profile series. Palm oil has the industry's most established certification scheme of any EUDR commodity — and a growing body of evidence showing certification and deforestation-free are not the same claim.

Map of EU palm oil import origins declining over time, alongside a diagram of RSPO certification timing versus forest loss

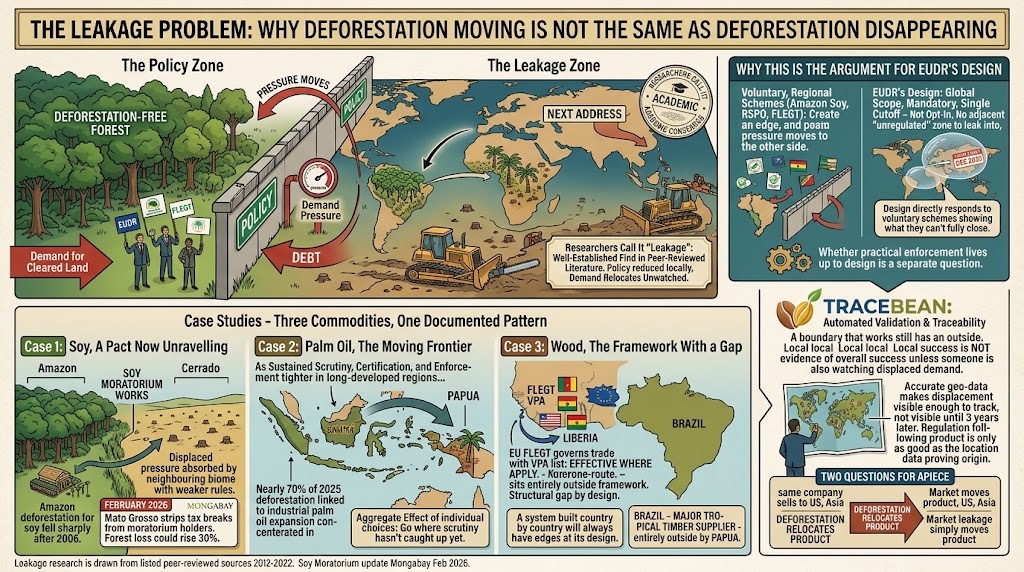
The Leakage Problem: Why Success in One Place Just Moves Deforestation to the Next

Cut off demand for deforested land in one protected area, and the pressure doesn't disappear. It finds the next place with weaker rules. Economists have a name for this, and we've now seen it in three different commodities from our own series.

Diagram showing deforestation pressure shifting from a protected region to an adjacent, less-protected region across soy, palm oil, and timber