A satellite flag on a farm polygon is not a verdict. It is not a compliance determination. It is not a reason to reject a shipment, drop a supplier, or close a sourcing relationship. It is a question — and the answer to that question requires a human being, not an algorithm.
This is not a philosophical position. It is a technical fact, rooted in what satellite datasets actually measure and what EUDR actually requires. The gap between those two things is wider than most people in the supply chain realise, and understanding it is the difference between a deforestation screening process that works and one that produces confidently wrong answers in both directions.
What Hansen actually measures
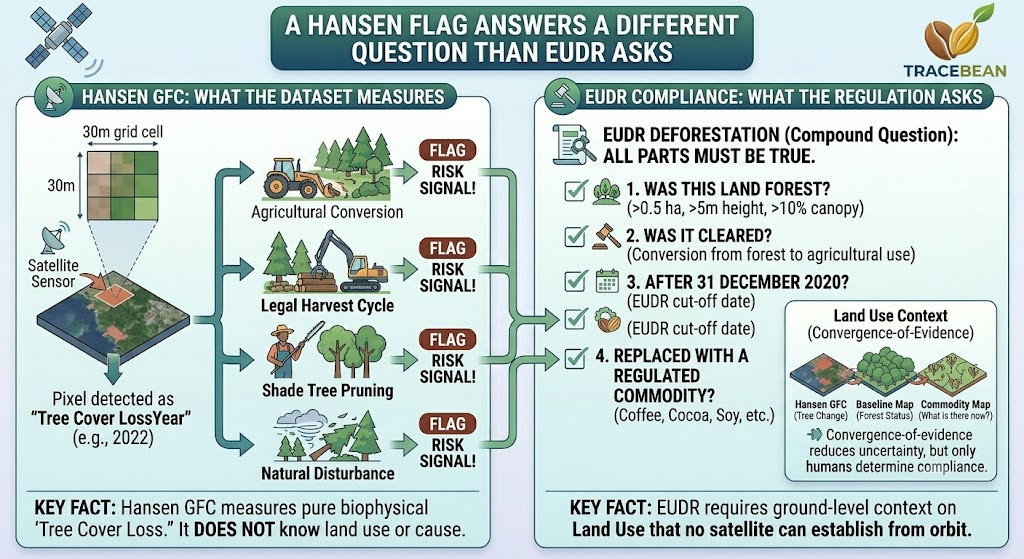
The Hansen Global Forest Change dataset — the most widely used deforestation reference layer in EUDR compliance tools — measures one thing: tree cover loss. A pixel in the Hansen "lossyear" layer tells you that satellite imagery detected a reduction in tree canopy at that 30-metre grid cell in a specific year. It does not tell you why.
Tree cover can decrease for many reasons. A forest can be cleared for agriculture — which is what EUDR is designed to detect. But tree cover also decreases when a coffee farmer prunes shade trees in an agroforestry system. It decreases when a road is built through a wooded area. It decreases when a windstorm knocks down a stand of trees that then regrow. It decreases when a timber plantation is harvested on a legal rotation cycle. Hansen registers all of these identically: tree cover loss, at this location, in this year.
Hansen's own documentation describes "loss" as a purely biophysical event — a disturbance leading to reduced tree cover. It does not distinguish between land uses, between biomes, or between causes. That is a reasonable design choice for a global monitoring product. It is also precisely why a Hansen flag cannot, on its own, answer the question EUDR asks.
What EUDR actually asks
EUDR's definition of deforestation is a compound question with multiple parts, all of which must be true simultaneously for a piece of land to count as deforested under the regulation.
Hansen can answer part of question 2 (something changed) and question 3 (it changed after 2020, via the lossyear layer). It cannot answer question 1 with certainty — a previous post in this series explored the 0.5-hectare minimum and why Hansen's 30-metre resolution struggles with that threshold. And it cannot answer question 4 at all. Hansen has no commodity layer. It does not know whether coffee, cocoa, soy, or a parking lot replaced the trees. That information requires a land-use classification dataset — a fundamentally different type of data that Hansen was never built to provide.
The tools that try to close this gap
The satellite monitoring community is well aware that a single dataset cannot answer EUDR's compound question. The most rigorous approaches use convergence-of-evidence — cross-referencing multiple independent datasets to reduce the uncertainty that any single source carries on its own.
FAO's WHISP platform ("What is in that plot?") is one of the most developed free tools for this kind of multi-dataset cross-validation, designed specifically for EUDR due diligence contexts. It combines tree cover change, baseline forest classification, and land use indicators to produce a more complete picture than any single layer can provide.
Even with triangulation, the result is still a probability assessment — not a verdict. Multiple datasets agreeing that tree cover changed at a location after 2020, on land that was baseline forest, in a region where the commodity in question is grown, increases confidence. It does not reach certainty. The final determination — "this specific plot was cleared for this specific commodity in violation of EUDR" — requires ground-level information that no satellite can provide from orbit.
Why the polygon matters more than the dataset
There is a part of this problem that gets almost no attention, even though it sits upstream of every satellite check and determines the quality of every result that follows.
Every deforestation screening — whether it uses one dataset or ten — begins with a polygon: a boundary that says "this is the farm, check this piece of land." The satellite analysis runs against that polygon. If the polygon is wrong, the analysis is wrong. Not uncertain, not approximate — wrong.
A polygon submitted in the wrong coordinate reference system places the farm in a different location entirely. The satellite tool checks a piece of land that is not the farm, produces a perfectly calculated result for that wrong location, and returns it with full confidence. A polygon that is too loosely drawn — extending beyond the cultivated area into adjacent forest — pulls tree cover into the analysis that has nothing to do with the farm itself. The satellite tool dutifully detects that tree cover, flags it, and the farmer receives a risk signal for trees that are not on their land.
Polygon checked against Hansen: no tree cover loss detected. ✓
But the polygon was in the Bay of Bengal, not Honduras.
The real farm — never checked — sits on land cleared in 2022.
Result: a clean signal for the wrong location.
The most dangerous kind of error — a confident false negative.
This is not a hypothetical scenario. It is the kind of error that appears routinely in supplier geo-data files — coordinate systems that do not match, latitude and longitude values that are swapped, decimal points that are missing or misplaced. Each of these produces a polygon that looks valid, parses without error, and sends the satellite check to the wrong place.
The most sophisticated deforestation analysis available — multi-dataset triangulation, convergence of evidence, AI-assisted classification — is only as reliable as the polygon it runs against. A wrong polygon does not produce an uncertain result. It produces a confidently wrong one.
What a signal is for
If a Hansen flag is not a verdict, what is it? It is an attention router. It tells a human reviewer: look at this farm more closely. Something changed at this location after 2020. It might be genuine clearing. It might be an edge effect at 30-metre resolution where the farm boundary runs along a forest margin. It might be shade tree pruning in an agroforestry system. The flag does not know which one. The human's job is to find out.
A flag that says "tree cover loss detected — human review required" is useful precisely because it is honest about what it knows and what it does not. A flag that says "EUDR non-compliant" — based on the same underlying data — pretends to have answered a question it has not. It claims to know that the loss was forest (not shrubland or savanna), that it was converted to a commodity (not a road), and that it happened after the cut-off date with pixel-level precision. None of these are things a 30-metre global tree cover dataset can establish alone.
The same logic applies to the absence of a flag. "No tree cover loss detected" is a factual statement about what one dataset observed at one resolution. It is not a compliance certificate. Hansen does not reliably detect clearing below half a hectare. It does not see savanna conversion the same way it sees dense canopy loss. It does not detect under-canopy changes in agroforestry systems where the shade layer remains intact while the understory is cleared. A clean Hansen signal is the beginning of a due diligence assessment, not the end of one.
Where this leaves the operator
An operator who relies on a single satellite check as a compliance verdict — in either direction — is exposed. A clean result may miss what Hansen cannot see. A flagged result may trigger unnecessary supplier disruption over an edge effect or a pruning cycle. In both cases, the operator carries the legal responsibility for the accuracy of the determination, regardless of which tool produced it.
The operators who navigate this well tend to do two things. First, they treat satellite results as one input among several — a starting point for investigation, not a final answer. Second, they invest in the quality of the data that goes into the check in the first place — making sure the polygon is correct, the coordinate system is right, and the geometry is valid before any satellite analysis runs against it. Because the cleanest possible input is the only way to ensure that when a flag does appear, it represents a real question worth investigating — not a ghost created by a data error that should have been caught upstream.
TraceBean validates and corrects farm geo-data before it reaches any satellite screening tool. Coordinate system mismatches, swapped axes, decimal errors, invalid geometries — these are the errors that turn a deforestation check into a check against the wrong piece of land. TraceBean does not issue compliance verdicts. It ensures that the data feeding the screening is clean — so that when a tree-cover-loss signal appears, the question it raises is a real one, not an artefact of dirty data.
Where TraceBean runs a Hansen GFC overlay as a supplementary risk signal, the output is explicitly labelled as such: a tree-cover-loss signal, not a compliance determination. The report states what was found, at what resolution, with what known limitations — and leaves the compliance decision where EUDR places it: with the operator.
Sources: Hansen et al., Global Forest Change dataset documentation; EUDR Article 2, definitions; Satelligence, "Deforestation alerts without land-use data"; FAO WHISP platform; World Resources Institute, forest monitoring methodology.
← Back to Blog