
We wrote earlier about how the EUDR data problem looks different depending on which of the seven commodities you're importing — coffee's washing-station chains and format chaos versus soy's commingled trading hubs versus palm oil's multi-tier mills. That post was about the shape of the data problem. This one is about the trade itself: where coffee actually comes from, who in the EU brings it in, and why the regulation singles it out to begin with.
Why coffee is regulated at all
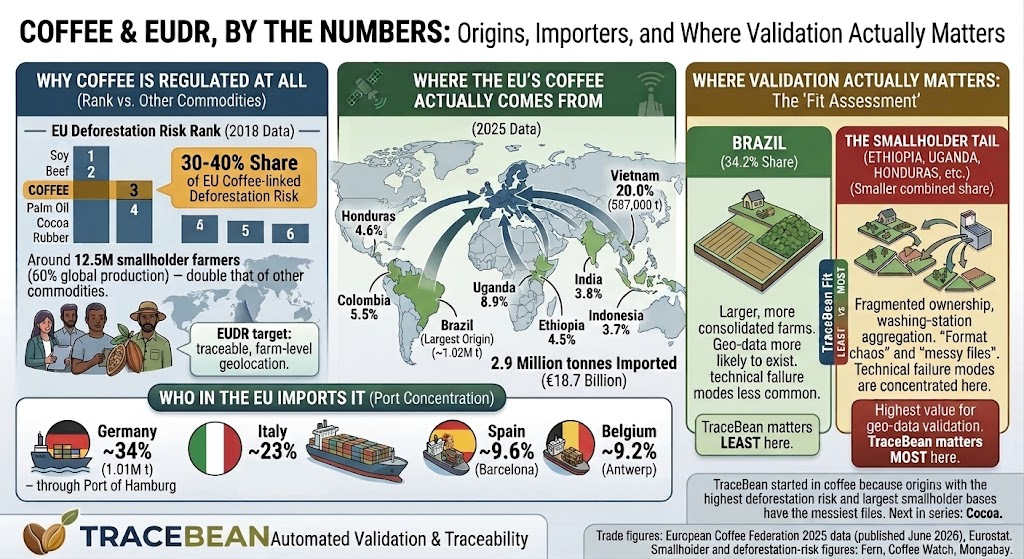
Coffee didn't end up in EUDR's seven commodities by default. By the most recent year with full comparative data (2018), coffee ranked as the third-highest deforestation-risk commodity the EU imports, behind only soy and beef — ahead of palm oil, cocoa and natural rubber. Estimates put the EU's share of coffee-linked embodied deforestation at 30–40%, higher than for most of the other six commodities.
Scale is part of the story. Around 12.5 million smallholder farmers grow roughly 60% of the world's coffee, typically on plots under five hectares — nearly double the number of smallholder producers in palm oil, rubber or cocoa. A regulation built around traceable, farm-level geolocation runs straight into a production base that is, structurally, the hardest of the seven to make traceable.
Where the EU's coffee actually comes from
In 2025 the EU imported 2.9 million tonnes of green and roasted coffee from outside the bloc, worth €18.7 billion — around 24% of everything the world drinks.
Who in the EU imports it
Import volume concentrates heavily in a handful of ports. Germany alone handled about 34% of all EU coffee imports in 2025 (roughly 1.01 million tonnes), most of it through the Port of Hamburg — one of the world's major coffee ports. Italy follows at around 23%, with Spain (9.6%, via Barcelona) and Belgium (9.2%, via Antwerp) rounding out the top four.
Not all coffee is the same coffee
Here's where a single import number hides more than it reveals. Brazil supplies over a third of everything the EU drinks — and Brazilian coffee farms are, on average, considerably larger and more consolidated than coffee farms in Ethiopia or Uganda. Brazil is the notable exception to the smallholder pattern that defines the rest of the sector.
That split matters for anyone assessing where a geo-data validation layer actually earns its keep. The largest single line item in EU coffee imports is not automatically the place where the work is hardest, or where it's most needed.
A third of EU coffee comes from the origin where TraceBean matters least. The bulk of where it matters most is spread across a long tail of smaller, smallholder-heavy origins — Ethiopia, Uganda, Honduras among them.
Where this leaves the fit assessment
Coffee's inclusion in EUDR is well justified by the numbers: a top-three deforestation-risk commodity, a smallholder base twice the size of comparable sectors, and a EU market absorbing nearly a quarter of global supply. But "coffee needs geo-data validation" is a different claim from "every tonne of EU coffee needs it equally." As covered previously, the technical failure modes — coordinate errors, format chaos, washing-station aggregation — are concentrated in exactly the origins where smallholder farming dominates, not in Brazil's larger, more established operations.
Coffee is where TraceBean started, and the trade data explains why: the origins with the highest deforestation-risk profile and the largest smallholder base are also the ones producing the messiest files. For the technical detail on what that mess looks like and how much of it is auto-correctable, see our earlier breakdown of the coffee data problem.
Next in this series: cocoa — where the smallholder numbers are even larger, and the supply chain looks structurally different again.
Trade figures are drawn from the European Coffee Federation's "Economic Impact of Coffee in Europe" report (Europe Economics, 2025 data, published June 2026) and Eurostat. Smallholder and deforestation-risk figures are drawn from Fern, Coffee Watch, and Mongabay commentary citing Wageningen Economic Research and 2018 EU trade-linked deforestation estimates — the most recent year with full comparative data across commodities.
← Back to Blog