
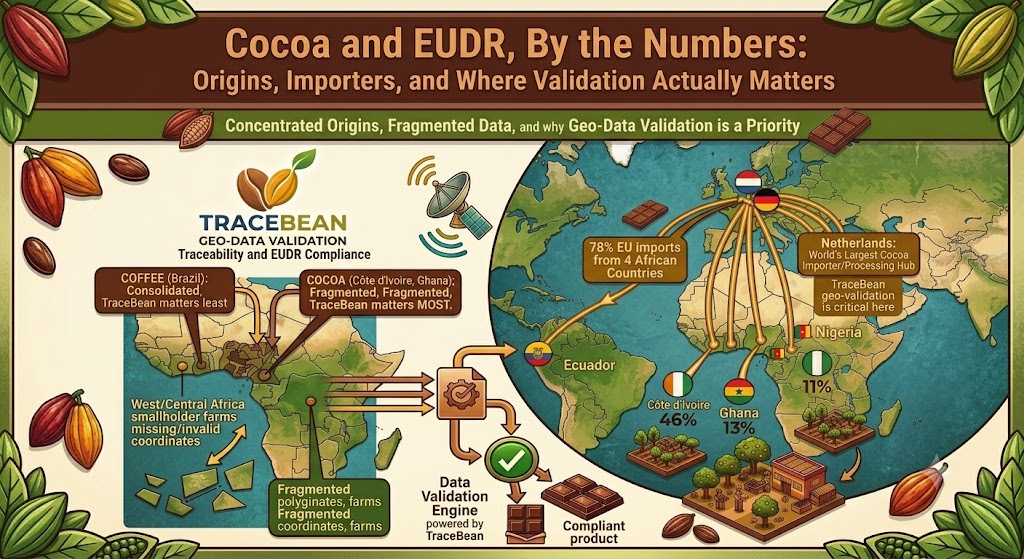
We opened this series with coffee, and touched on cocoa briefly in an earlier comparison of upstream data problems. This post does for cocoa what the coffee post did for coffee: the trade picture, not the data-format picture — where it actually comes from, who imports it, and why the regulation treats it as a priority commodity.
Why cocoa is regulated at all
Cocoa's link to deforestation is unusually direct and unusually well measured. A 2023 peer-reviewed study combining plantation data with satellite imagery found that cocoa cultivation is an underlying driver of over 37% of forest loss inside protected areas in Côte d'Ivoire, and over 13% in Ghana — the world's two largest producers, together accounting for around 60% of global supply. The same research puts national forest cover loss since 1950 at over 90% in Côte d'Ivoire and over 65% in Ghana.
Almost two million farmers in these two countries alone depend on cocoa as their primary crop, most on plots of three to five hectares. Unlike some other EUDR commodities, this isn't a case of scattered anecdotal concern — it's one of the most rigorously mapped deforestation-commodity links in the tropical agriculture literature.
Where the EU's cocoa actually comes from
The EU imports roughly 1.7–1.8 million tonnes of cocoa beans a year from outside the bloc.
These four West and Central African origins together supply around 78% of the EU's cocoa bean imports from producing countries. Ecuador is the notable outlier — its share has grown from roughly 5% to 8% in recent years as European buyers diversify toward Latin American and fine-flavour origins, alongside smaller but growing volumes from Peru, Colombia and Bolivia.
Who in the EU imports it
Cocoa's import geography is dominated by one country to a degree unusual even among EUDR commodities: the Netherlands is the world's largest importer of cocoa beans by volume, processing the bulk of it in the Zaanstreek region after it arrives through the Port of Amsterdam, the world's leading cocoa trading hub. In 2025 the Netherlands overtook Germany as the world's largest exporter of cocoa products — chocolate, cocoa mass, butter and powder — despite producing none of the raw material itself.
Germany remains the second-largest importer, with a chocolate manufacturing base of its own. Belgium and France follow, the latter importing around 128,000 tonnes in 2024 primarily through the HAROPA port group.
Unlike coffee, there's no large exception here
In the coffee post, Brazil stood out as the one major origin where farms tend to be larger and more consolidated than the smallholder norm — a partial exception worth flagging honestly. Cocoa doesn't offer the same out. Côte d'Ivoire and Ghana are simultaneously the two largest sources of the EU's cocoa and two of the most smallholder-fragmented, with almost two million farmers between them working three-to-five-hectare plots.
With coffee, the biggest supplier was also the place TraceBean's kind of work matters least. With cocoa, the biggest suppliers are exactly where it matters most.
Where this leaves the fit assessment
As covered previously, cocoa's upstream data problem shares coffee's core pattern — coordinate errors, missing polygons, inconsistent supplier IDs — at higher volume and without a washing-station intermediary to absorb some of the inconsistency. The trade data here reinforces rather than complicates that picture: the two dominant origins are both smallholder-heavy, both carry a well-documented deforestation footprint, and neither offers a large-farm exception the way Brazilian coffee does.
Cocoa was one of the two commodities TraceBean was built around from the start, alongside coffee — and the trade data explains why: concentrated, well-documented, smallholder-fragmented origins are exactly where geo-data validation earns its keep. For the technical detail on cocoa's specific data patterns, see our earlier breakdown of the cocoa data problem.
Next in this series: rubber, palm oil, soy, wood and cattle — each with a very different origin geography, and a different answer to whether TraceBean's kind of validation is the bottleneck at all.
Deforestation figures are drawn from Kalischek et al., "Satellite-based high-resolution maps of cocoa planted area for Côte d'Ivoire and Ghana," and the related Nature Food study (2023). Trade figures are drawn from UN Comtrade / World Bank WITS (2023), CBI (Centre for the Promotion of Imports from Developing Countries, Netherlands), and Statistics Netherlands (CBS, 2025 data).
← Back to Blog