Three names, three different questions
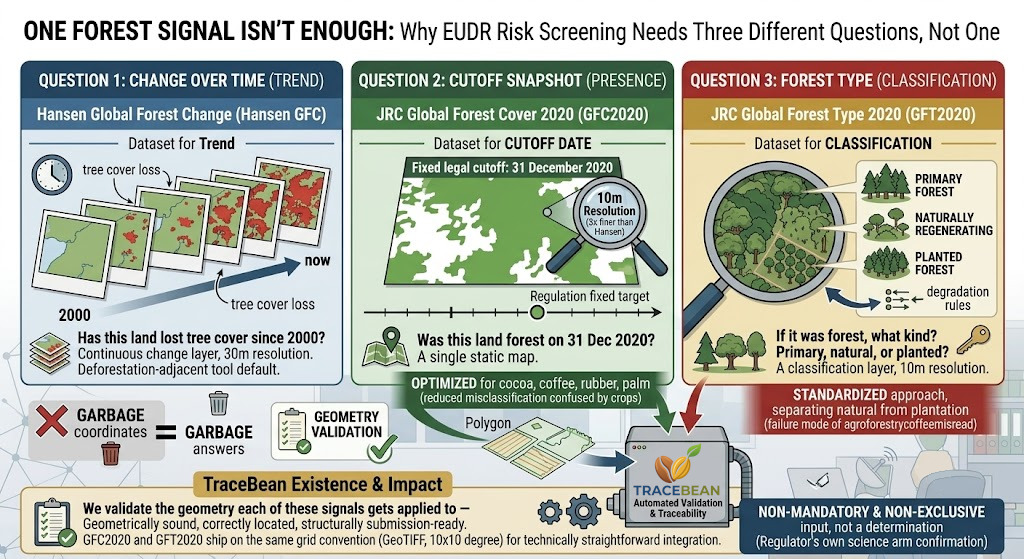
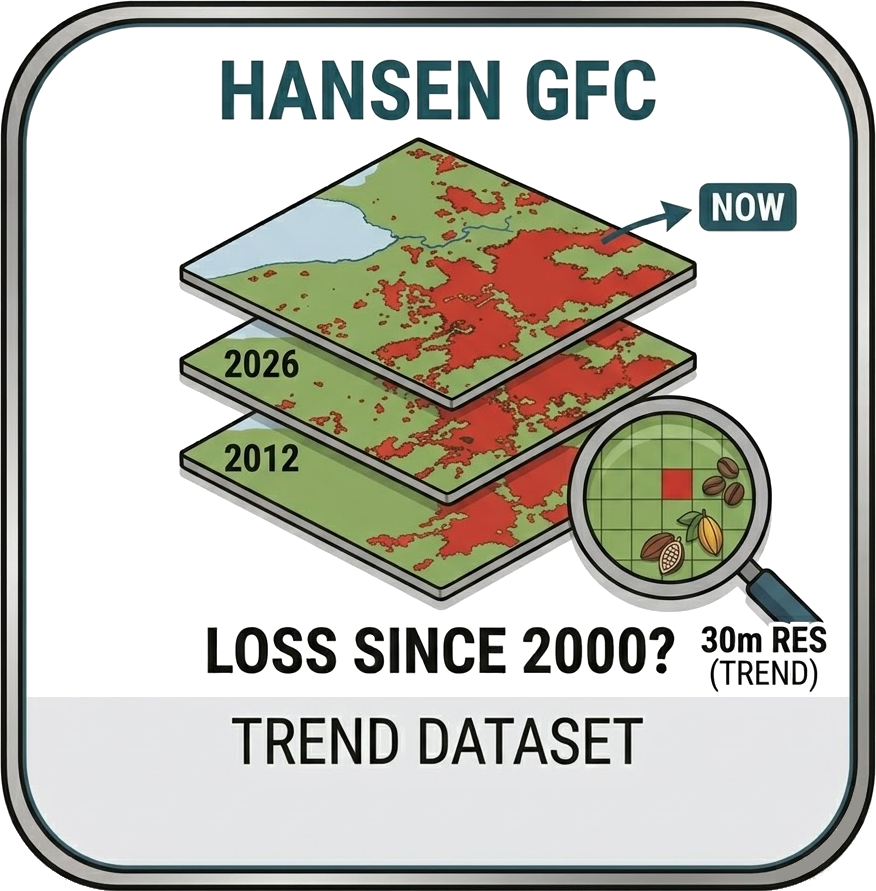
We've used Hansen Global Forest Change since the start — annual tree-cover-loss tiles, 30m resolution, tracking change year over year since 2000. It's the dataset most EUDR-adjacent tools default to, ours included. What gets missed is that Hansen was never built to answer the specific legal question EUDR asks: was this land forest on 31 December 2020, the regulation's fixed cutoff date. Hansen measures change; EUDR needs a snapshot.
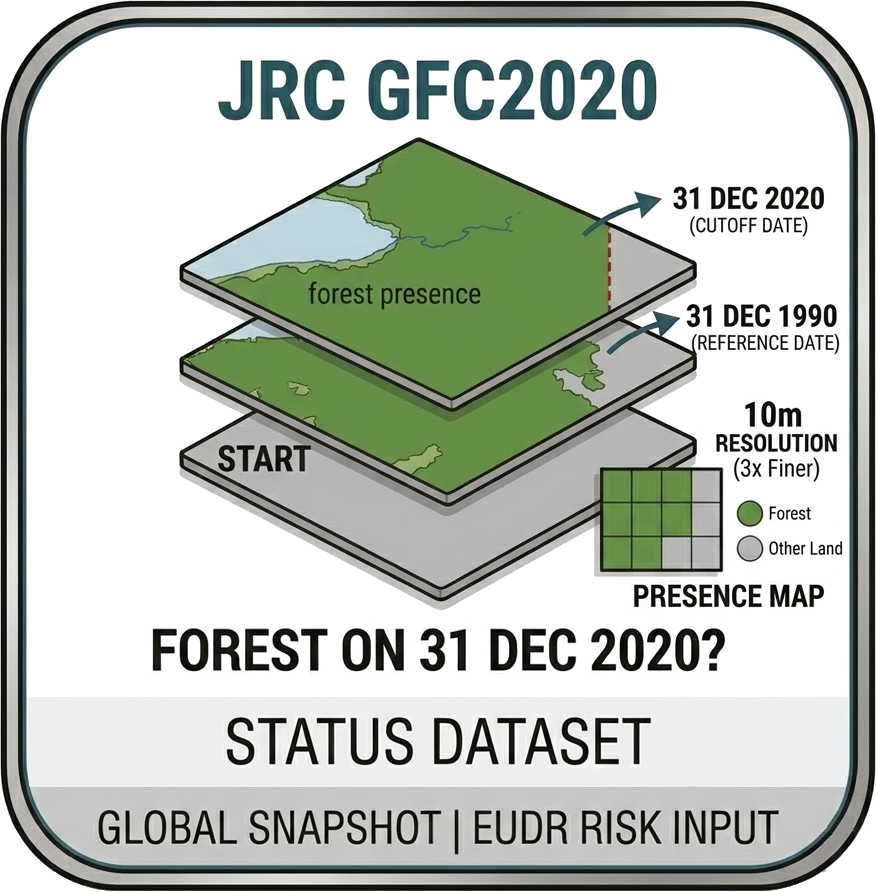
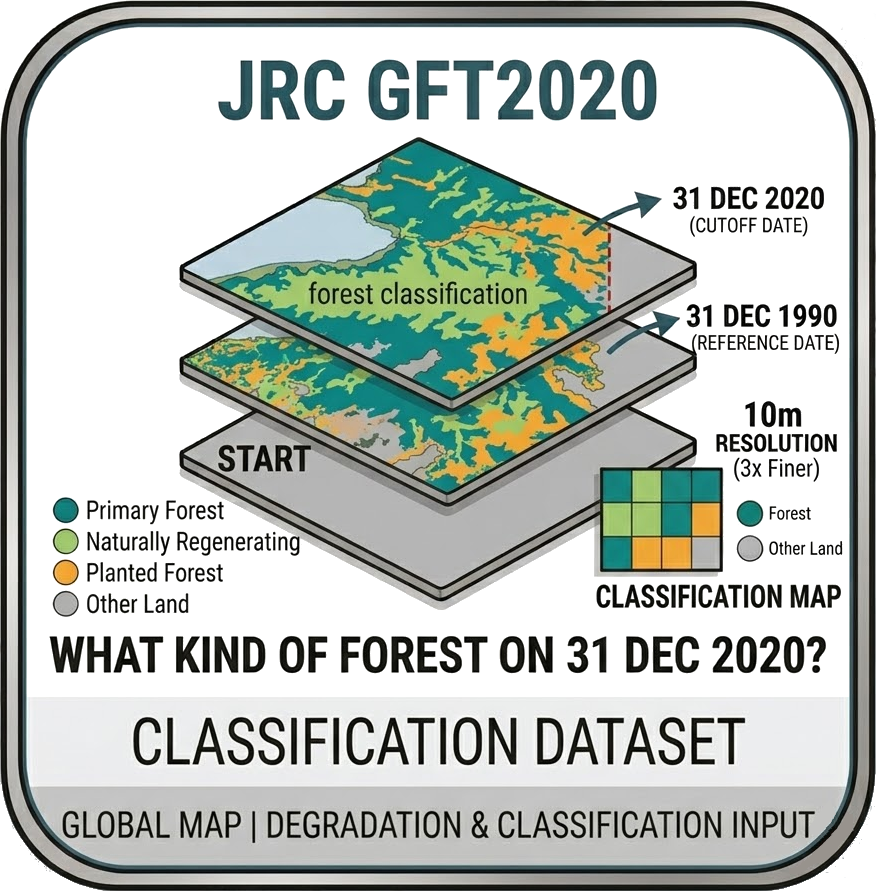
That gap is exactly what the EU's Joint Research Centre built GFC2020 to close: a single, static map of forest presence and absence as of the cutoff date, at 10m resolution — three times finer than Hansen. And because "was it forest" isn't the whole question either — a plantation and a primary forest are both "forest" in a presence/absence sense, but very different things under EUDR's degradation rules — the JRC followed with GFT2020, which classifies forest type: primary, naturally regenerating, or planted.
Why the distinction isn't academic
A parcel can show tree-cover loss in Hansen's data and still be irrelevant to an EUDR risk assessment, if that loss happened in 2015 — well before the cutoff Hansen wasn't built to isolate. Conversely, a parcel can look clean in a raw Hansen read simply because the change happened outside the window a particular query covers. GFC2020 sidesteps that ambiguity by design: it's not a trend, it's a fixed point matched to the exact date the regulation cares about.
Forest type adds a second axis entirely. A plantation harvested and replanted on a normal rotation will register as "forest" in a presence/absence map and may even show apparent loss-then-regrowth in a change layer — neither of which is the same signal as primary forest being cleared for the first time. This is precisely the failure mode we've written about before with shade-grown and agroforestry coffee being misread as deforestation. GFT2020 is the first global, standardised attempt to separate that out at scale, rather than leaving it to regional workarounds.
What the accuracy numbers actually say
JRC's own methodology reporting is specific about this rather than vague: revisions to GFC2020 have particularly reduced confusion for agricultural tree crops including cocoa, coffee, rubber and oil palm — the map's builders explicitly optimised for exactly the crops that get misclassified most often. That's a meaningfully different claim from "this dataset is accurate," and it lines up with the commodities most of our own customers work with.
It's not a blank cheque, though. JRC's published accuracy assessment puts overall performance in the mid-70s percent, with omission errors — real forest missed by the map — outnumbering false positives. In practice: GFC2020 is more likely to under-flag genuine forest than to wrongly accuse land that isn't forest. Useful to know when a risk assessment comes back clean; clean doesn't mean checked with certainty, it means nothing was caught this time.
JRC describes both GFC2020 and GFT2020 as non-mandatory, non-exclusive and not legally binding — a risk-assessment input, not a determination. That's the same distinction we've built TraceBean around for our own Hansen overlay, coming from the regulator's own science arm rather than from us.
Where this points, practically
None of these three datasets replaces the others, and none of them replaces geometry validation. A perfectly classified forest-type map still needs a correctly formatted, structurally valid farm polygon to be checked against — garbage coordinates return garbage answers regardless of how good the underlying forest data is. What changes is which question you're actually asking: a trend question goes to Hansen, a cutoff-date question goes to GFC2020, and a natural-versus-planted question goes to GFT2020. Treating any one of them as a universal answer is where the misreadings start.
TraceBean doesn't ask you to pick a favourite forest dataset. We validate the geometry each of these signals gets applied to — geometrically sound, correctly located, structurally submission-ready — so that whichever risk layer you or your downstream compliance tool chooses to run, it's running against a polygon that actually describes the plot in question.
GFC2020 and GFT2020 ship as GeoTIFF tiles on the same 10×10 degree grid convention as Hansen — a detail that matters more for our own roadmap than for yours, but it means these layers are technically straightforward for us to bring in alongside what we already run.
Dataset methodology and accuracy figures are drawn from JRC publications on GFC2020 (Bourgoin et al., versions 1–3, 2024–2025) and GFT2020 (version 1, January 2026), and the peer-reviewed ESSD article on GFC2020 (2026). Maps are hosted via the EU Observatory on Deforestation and Forest Degradation (EUFO) and the FOROBS data portal.
← Back to Blog